Synced from upstream — do not edit this file directly
This page is generated from
CARSSCenter/Chemical-Sensors at characterization-of-echem-sensors.md as of commit e5da30f.
To change it, edit the file upstream and re-run tools/sync_docs.py.
Use the "Edit this page" link above to go straight to the upstream source.
NEST 5-Electrochemical Characterization and Validation of Electrochemical Sensors
1. Summary of Y1
In year 1 of the project period, fabrication and modification of thin film parylene electrodes with 200 nm Pt metal electrodes was carried out. We explored different metal nanoparticles for modification of the surface of the working electrode, and down-selected the combination of gold and palladium metal nanoparticles for increasing the surface area of the working electrode. Following metal nanoparticle deposition, we used electropolymerization to modify the electrode surface with conductive polymers. In year 2, modification of the electropolymerization process was continued and followed by sensor characterization and calibration for catecholamine sensing. For pH and ACh sensing, modification of Pt thin film parylene electrodes did not result in stable emf over time. A new direction is being pursued in year 2, where we are carbonizing the thin film parylene electrodes using a laser to pattern the conductive leads directly on the substrate. This approach allows for direct carbon engraving on the parylene substrate and minimizes the number of interfaces that cause sensor drift. Y2 report discusses progress.
2. Characterization of Bare Parylene-Based Electrodes
2.1. Materials
Conductive ink (EPO-TEK® MED-H20E) and insulation Epoxy (EPO-TEK® MED-301) for sensor connections were purchased from Epoxy Technology Inc., MA, USA. The connection wires with 0.02" outer diameter, and Kapton tape were purchased from McMaster. Potassium ferricyanide (III), potassium hexacyanoferrate (II) trihydrate, and potassium chloride were purchased from Sigma Aldrich, St. Louis, MO. Sulfuric acid and glass slides were purchased from VWR, West Chester, PA.
2.2. Equipment
- 760E Electrochemical Analyzer (CH Instruments, Bee Cave, Texas)
- TOMLOV DM602 HDMI Digital Microscope
2.3. Protocol
2.3.1. Electrode Fabrication
We developed a three-electrode cell fabricated on a thin parylene C film as shown below. The electrodes are in a module that is 20 mm x 4.5 mm (20 µm thick) with conductive leads made with a Ti/Pt/Au/Pt stack that is 20/25/100/50 nm, and electrodes diameter of 0.6 mm. Microfabrication techniques were used for fabrication of the sensor as detailed in the attached protocol named "Y2-NEST5-Fabrication of Echem Sensors". Figure 1.1 shows the electrode design and optical image of the electrodes.
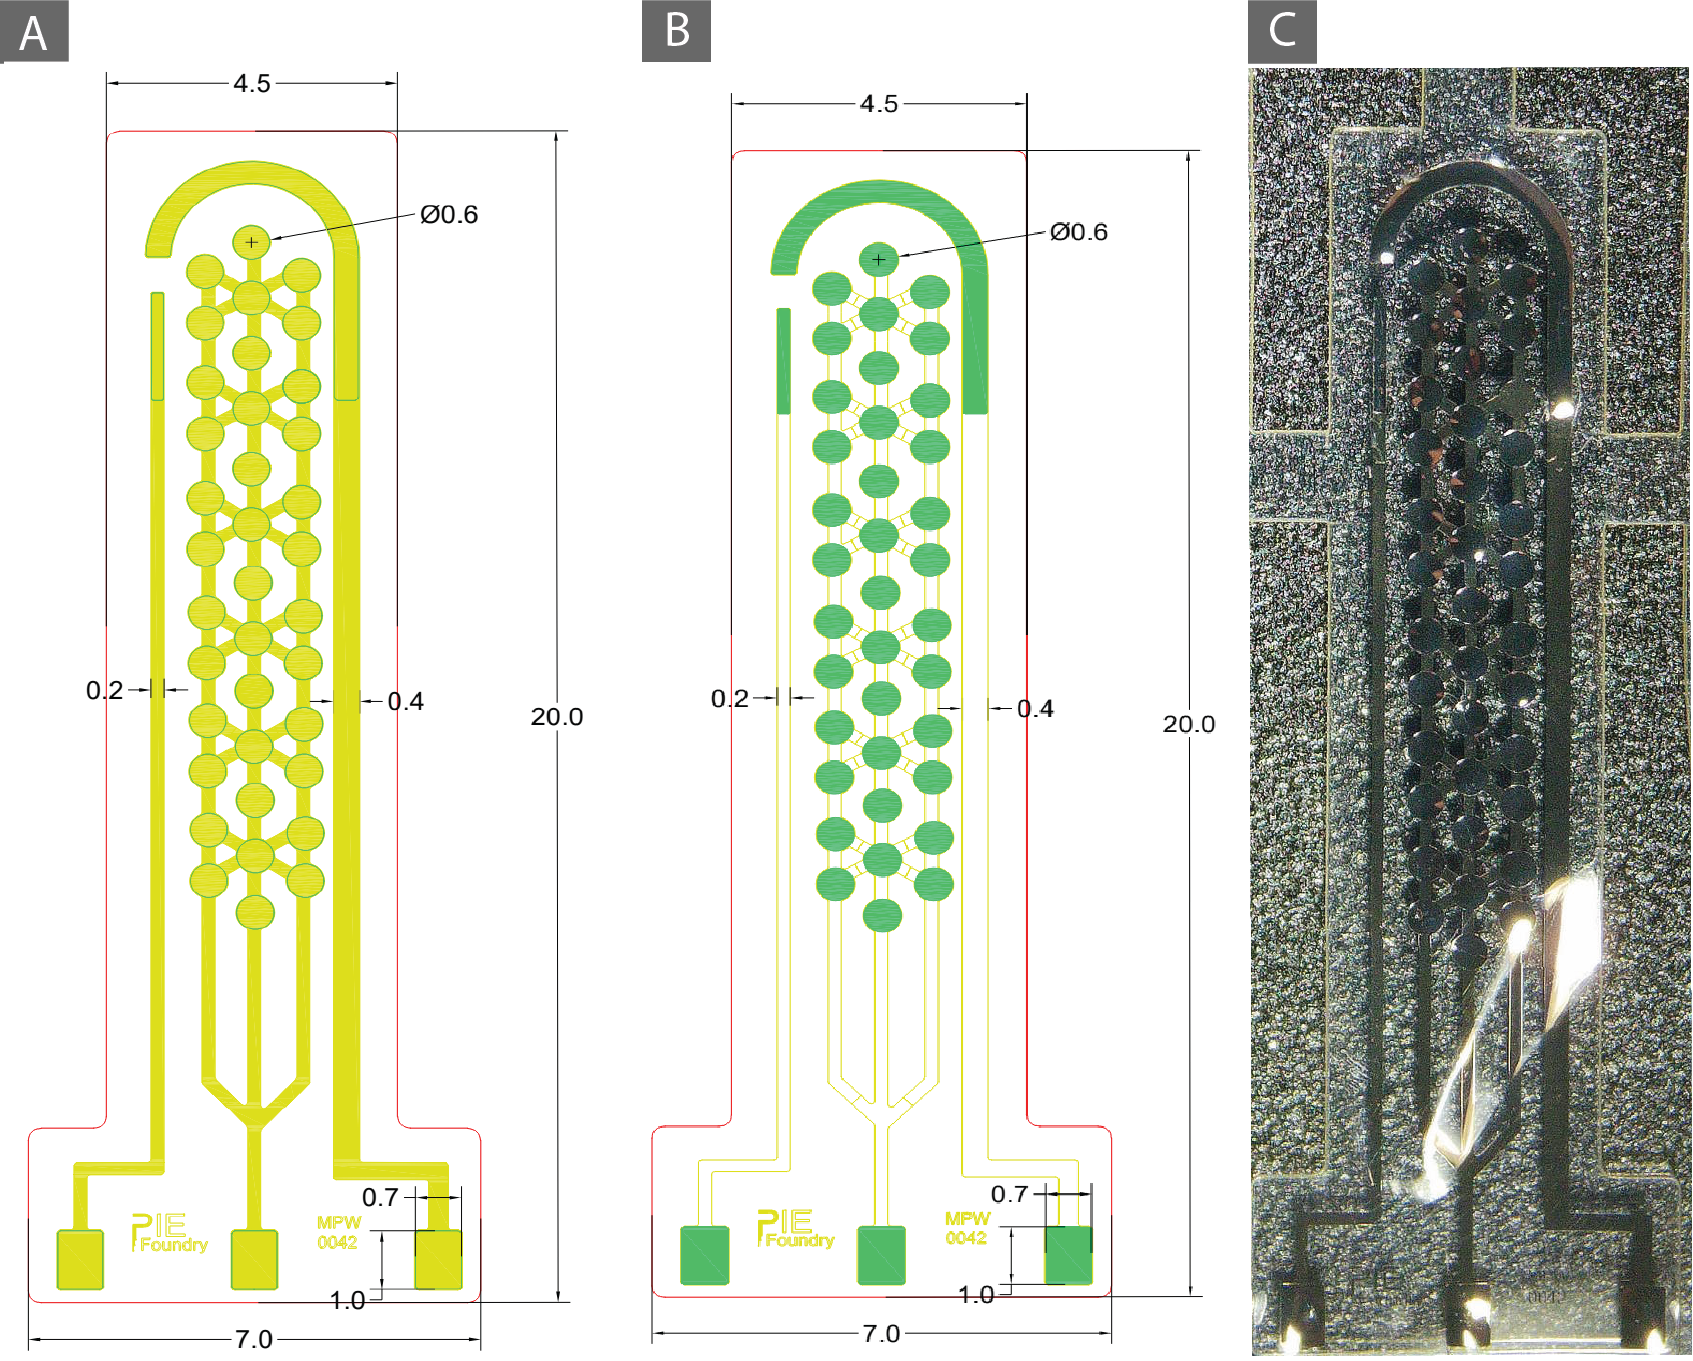
Figure 1.1. Schematic of the electrochemical sensor. (A) Metal deposition mask design. (B) Dry etching mask design. (C) Photo of the new thin film parylene catecholamine sensors.
2.3.2. Wire Connections
In order to make the device compatible with animal studies, ZIF connector and PEEK backing were omitted from our electrode connection method. Instead, we used silver ink and epoxy for connection of the wires to the sensor and insulation.
All the connection steps were performed under the microscope.
- Secure the electrodes on the glass slides.
- Fix the wires on the bonpads and secure them with kapton tape.
- Connect the wires to the pads with silver epoxy.
- Cure the ink in the oven at 55 C˙ for 5 hours.
- Apply the insulation epoxy on the connections.
- Cure the epoxy in the oven at 55 C˙ for 4 hours (or at room temperature overnight).
- Apply Isopropanol to remove the Kapton tapes.
2.3.3. Electrode Cleaning Protocol
In order to remove the residuals of the fabrication process from the electrodes and provide a clean Pt surface for the deposition of the nanoparticles deposition and PEDOT:PSS layer, we performed acid cleaning on the electrodes.
- Connect the electrodes to the potentiostat (Ag/AgCl external reference electrode and Pt wire as external counter electrode).
- Put 500 µl of 0.5 M H2SO4 on the electrodes.
- Perform 10 cycles of cyclic voltammetry from -0.2 V to 1.2 V with a scan rate of 100 mV/s vs the Ag/AgCl reference electrode.
2.3.4. Cyclic Voltammetry Test
Cyclic voltammetry in 5 mM Fe[CN]6 3-/4- was performed to compare the surface area of the electrodes with the previous design.
- Connect the electrodes to the potentiostat (Ag/AgCl external reference electrode and Pt wire as external counter electrode).
- Put 500 µl of 5 mM Fe[CN]6 3-/4- on the electrodes.
- Perform cyclic voltammetry from -0.4 V to 0.6 V with scan rate of 100 mV/s vs Ag/AgCl reference electrode.
2.4. Results
2.4.1. Characterization of the Bare Pt Electrodes
We designed the new electrode to have a higher surface area, leading to a higher current and lower detection of limit. To confirm the higher surface area of the new design, we performed a comparative study between the old and new designs.
Before starting the comparison we cleaned the electrodes using sulfuric acid to clean the residuals of fabrication steps from the surface of the electrode. Figure 2.1 shows the electrochemical impedance spectroscopy (EIS) and cyclic voltammetry (CV) results of the electrodes. Our results showed a substantial decrease in the charge transfer resistance as well as the appearance of redox peaks in Ferri/Ferrocyanide which confirms the effective cleaning process.
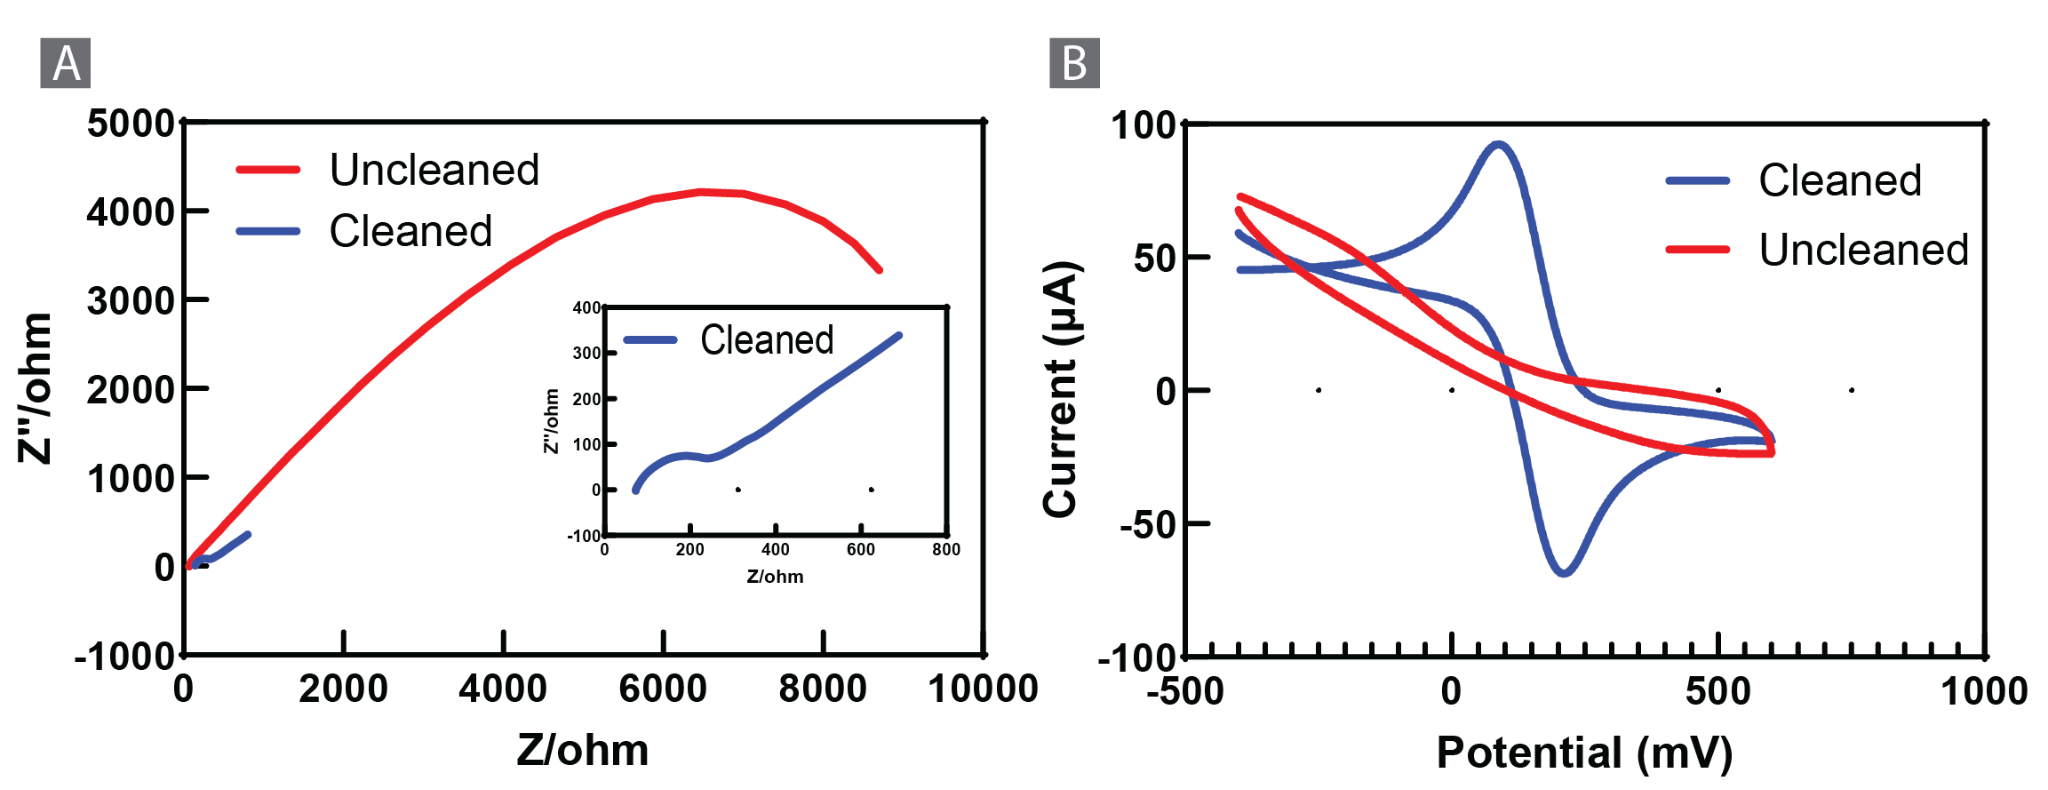
Figure 2.1. Acid cleaning of bare Pt electrodes (A) Comparison of electrochemical impedance spectroscopy of cleaned vs uncleaned electrodes (B) Comparison of electrochemical cyclic voltammetry results of cleaned vs uncleaned electrodes.
Fig 2.2 shows the comparison CV of the old and new design. As expected the current density results were similar; 9.20 µA/mm² and 9.16 µA/mm² for new and old design, respectively. Moreover, the peak current for the new electrode was 94.09 µA, which is three times higher than the older design. Based on the Randles–Sevcik equation shown below, where ip is the current peak, n is the number of electrons transferred in the electrochemical event, F is the Faraday's constant, A is the electrode area, D is the diffusion coefficient, C is the electrolyte concentration, υ is the scan rate, R is gas constant, and T is the temperature in Kelvin, the new design has nine times higher surface area.
$$i_p = 0.4463\ nFAC\sqrt{\dfrac{nf\upsilon D}{RT}}$$
$$\dfrac{i_{p1}}{i_{p2}} = \dfrac{A_1}{A_2}$$
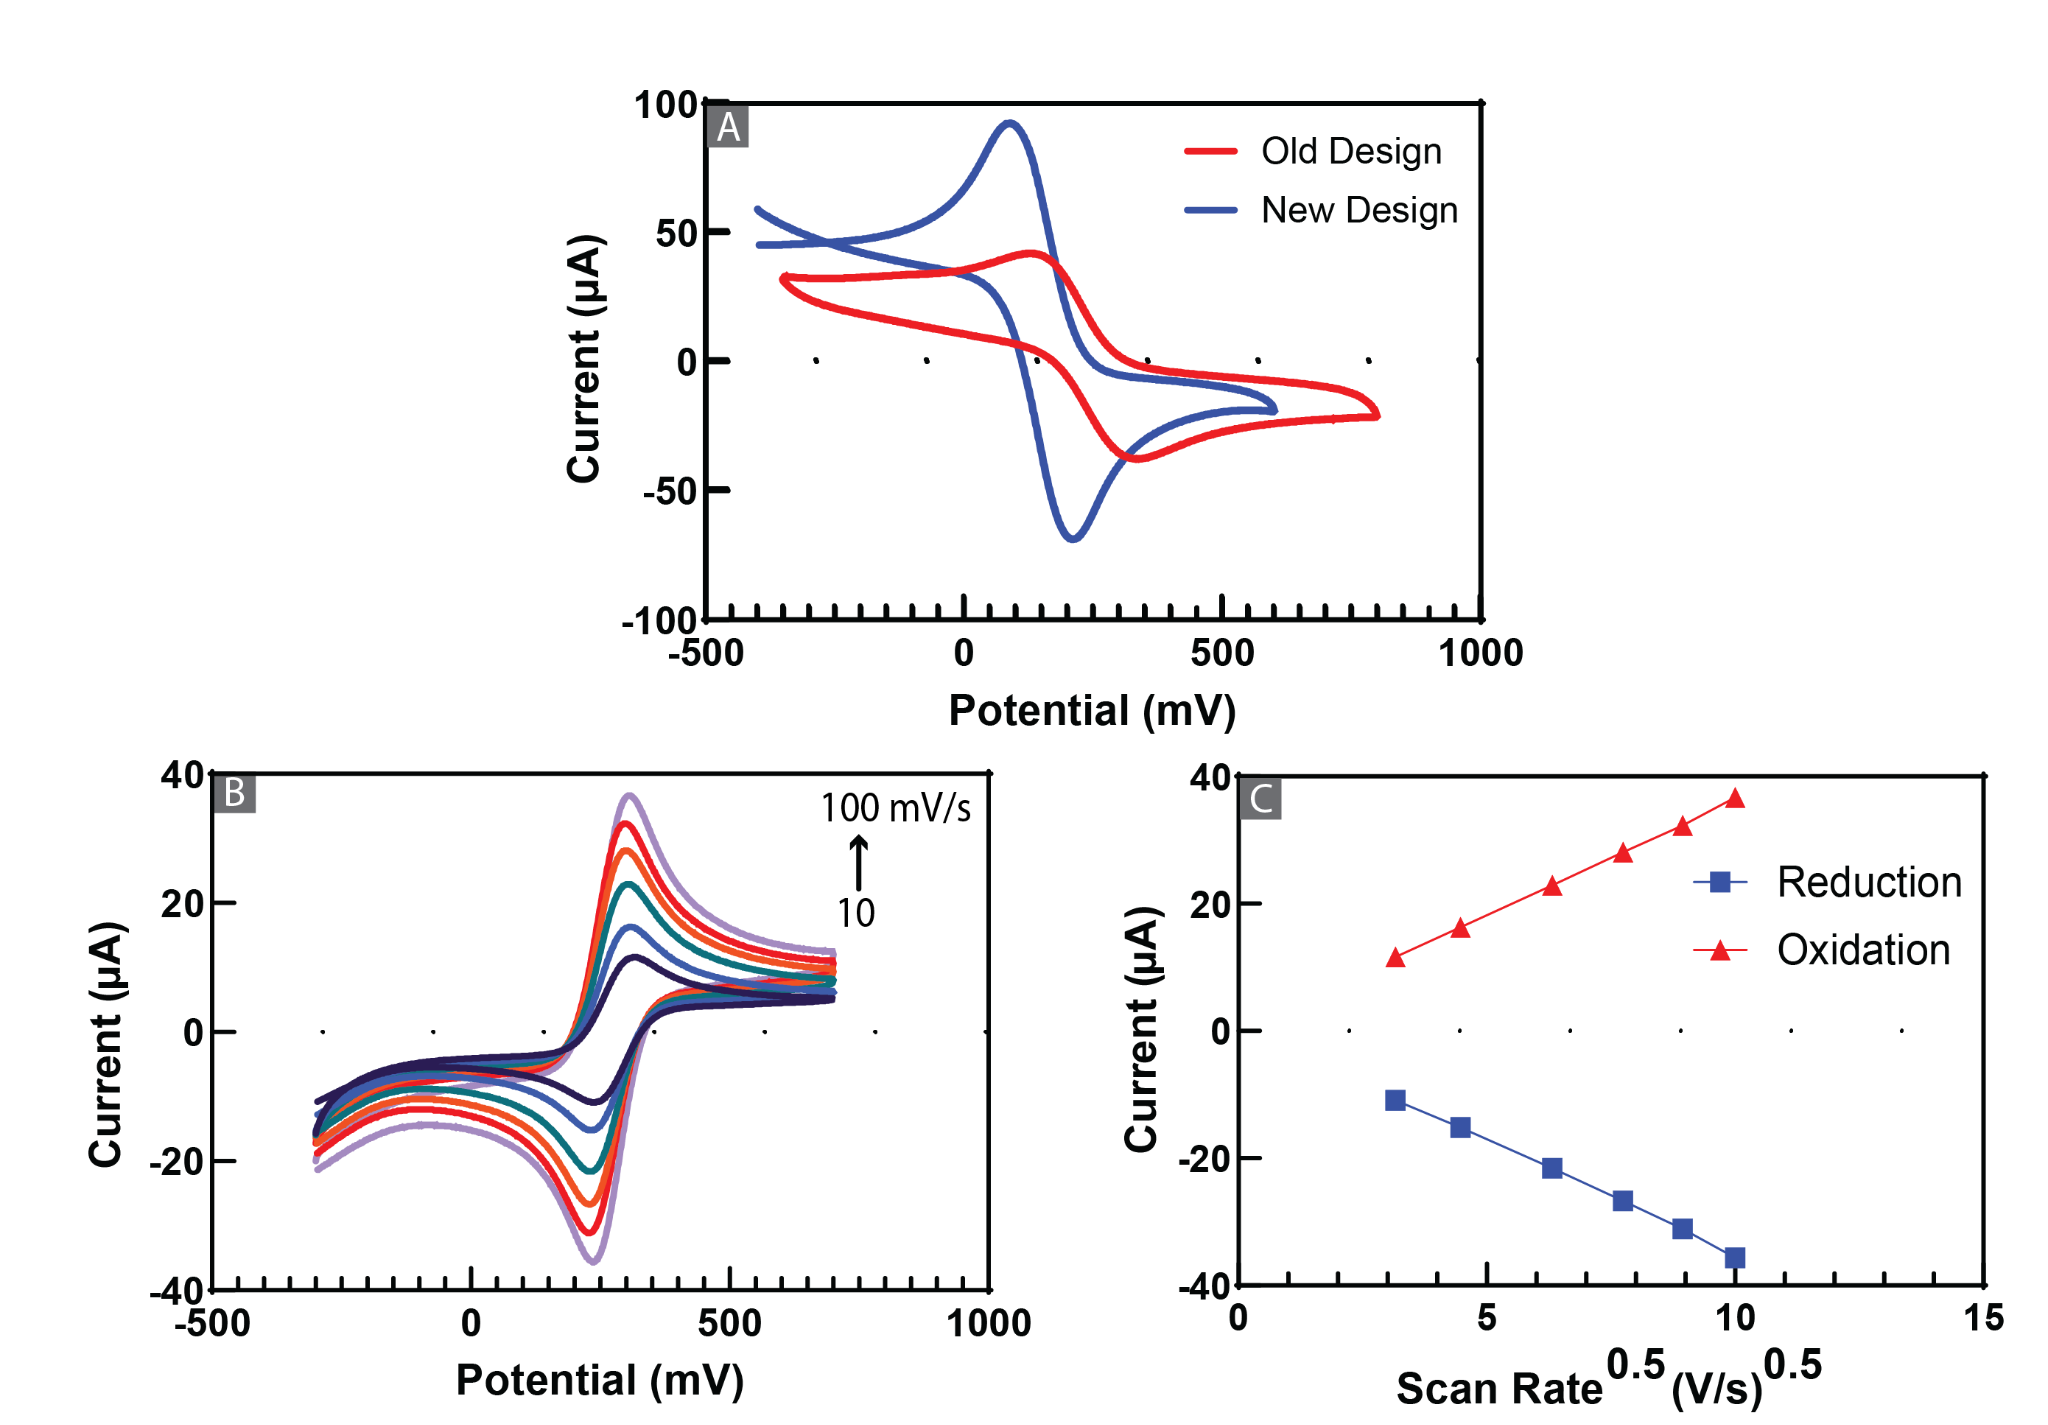
Figure 2.2. Comparison of new and old electrode design. (A) Comparison of electrochemical cyclic voltammetry results of old and new electrode designs. (B) Cyclic Voltammograms of the Pt electrodes obtained in an electrolytic solution of 2 mM [Fe(CN)6]3-/4- and 100 mM KCl at a scan rate between 10 and 100 mVs-1. (C) The relationship of the oxidation and reduction currents with the square root of the scan rate in cyclic voltammetry experiments.
To investigate the electrochemical performance of the electrodes, we tested the electrodes using the cyclic voltammetry technique in an electrolytic solution of 2.0 mM [Fe(CN)6]3-/4- and 100 mM KCl at a scan rate range between 10 and 100 mVs-1. Fig. 2.2C shows the increase of oxidation current (Ipa), reduction current (Ipc), and peak separation (∆Ep) with increasing the scanning rate. Also, a linear relationship was obtained between the current peaks and the square root of the scan rate, which refers to a diffusion-controlled charge transfer on the electrode surface (Fig. 2.2D).
3. Surface Modification of Catecholamine Electrodes
3.1. Materials
3,4-ethylene dioxythiophene (EDOT), poly (sodium 4-styrenesulfonate) (PSS, average Mw=70,000), palladium(II) chloride, and Gold(III) chloride trihydrate, were purchased from Sigma-Aldrich. Phosphate-Buffered Saline was received from VWR. All water-based solutions were prepared using ultrapure water obtained from a water purification system with a resistance of 18 MΩ.cm-1.
3.2. Equipment
760E Electrochemical Analyzer (CH Instruments, Bee Cave, Texas).
3.3. Protocol
In order to modify the electrodes first we deposit Gold (Au) and Palladium (Pd) nanoparticles using chronoamperometry. Next, we use cyclic voltammetry for electropolymerization of PEDOT:PSS on the electrode surface.
3.4.1. Gold and Palladium Electrodeposition
- Connect the electrodes to the potentiostat (Ag/AgCl external reference electrode and Pt wire as external counter electrode).
- Prepare the Au/Pd solution by mixing 50.0 µL of 3.0 mM HAuCl4 (in 0.1 M H2SO4) and 100.0 µL 1.0 mM PdCl2 (in 0.1 M H2SO4) followed by ultrasonic mixing for 3 minutes.
- Put 200 µl of the prepared solution on the electrode.
- Perform chronoamperometry for 120 s at a potential of -0.4 V.
- Rinse the electrode with deionized water, and store dry until further use.
3.4.2. Electropolymerization
- Connect the electrodes to the potentiostat (Ag/AgCl external reference electrode and Pt wire as external counter electrode).
- Mix 5 µl EDOT and 40 µl PSS in 5 mL of deionized water as the starting monomer solution for the electropolymerization.
- Add 500 µl of the starting monomer solution prepared in the previous step on the electrode surface.
- Perform 2 cycles of cyclic voltammetry from -1.0 V to 1.0 V with scan rate of 10 mV/s vs an external Ag/AgCl reference electrode using Pt wire as external counter electrode.
- Rinse the electrode with deionized water, and store dry until further use.
3.5. Results
In order to increase the surface area of the electrode and improve the limit of the detection of the device we electrodeposited Au/Pd nanoparticles on the surface of the electrode. Moreover, we electropolymerized 3,4-ethylene dioxythiophene (EDOT) to form Poly(3,4-ethylenedioxythiophene) (PEDOT), a conductive polymer, at the surface of the working electrode to enhance sensitivity, modify the surface charge, and increase biocompatibility of the electrodes. PEDOT plays a crucial role in electrochemical sensors due to several key factors. PEDOT exhibits favorable electrochemical properties, such as rapid charge transfer kinetics and high capacitance, which enhance the sensitivity and accuracy of the sensors. Furthermore, the versatility of PEDOT allows for customization and modification, enabling tailored performance for various applications such as healthcare diagnostics. Overall, these characteristics of PEDOT enable the development of sensitive and efficient electrochemical sensors with broad applications in different fields.
Electrochemical polymerization allows for the direct deposition of electrically conducting polymers onto metal neural electrode sites, resulting in very homogeneous, stable, and durable coatings. Poly(styrene sulfonate) (PSS) was selected as the counterion for PEDOT, serving as the supporting electrolyte and improving the dissolution of the EDOT monomer in water.
The electropolymerization of PEDOT occurs via the oxidation of the monomer, leading to radical coupling. When the oligomer chains reach sufficient length, they precipitate onto the electrode, forming the initial polymer nuclei. This process is initially controlled by monomer diffusion. Subsequently, these nuclei combine to form polymer globules.
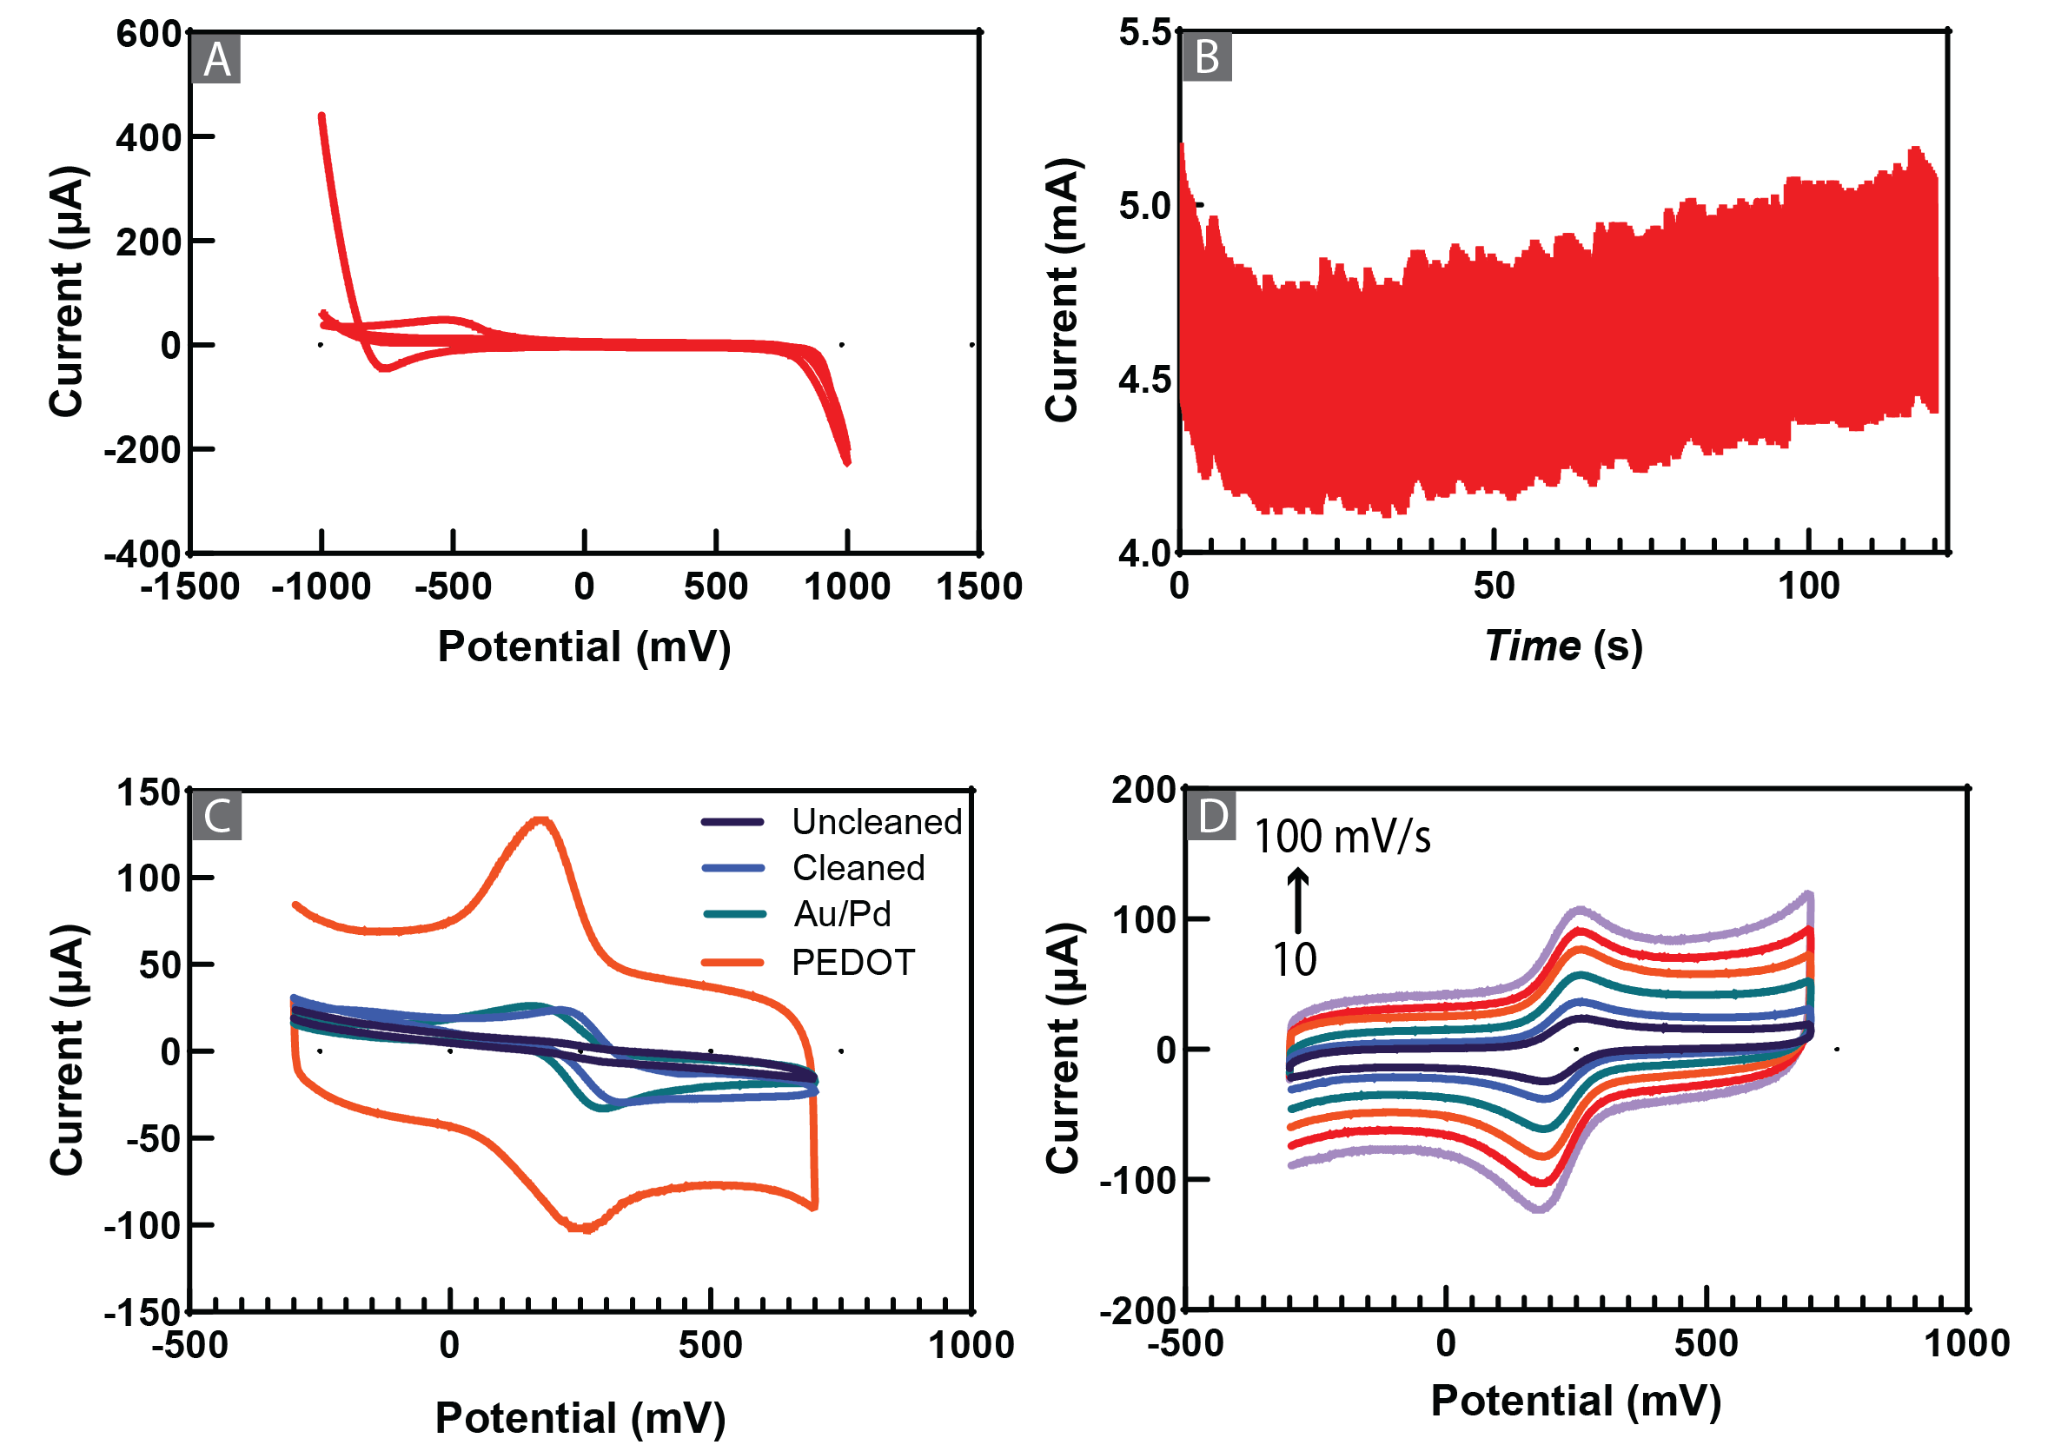
Figure 3.1. Electropolymerization and electrodeposition results. (A) CV of electropolymerization of PEDOT on the electrode surface. (B) I-t curve of electrodeposition of Au/Pd on the electrode. (C) Cyclic Voltammograms of the electrodes after each deposition step obtained in an electrolytic solution of 2 mM [Fe(CN)6]3-/4- and 100 mM KCl. (D) Cyclic Voltammograms of Au/Pd-PEDOT deposited electrodes obtained in an electrolytic solution of 2 mM [Fe(CN)6]3-/4- and 100 mM KCl with scan rates from 10 to 100 mV.s-1.
4. Catecholamine Measurements and Characterization
4.1. Materials
Sodium chloride, calcium chloride, potassium chloride, magnesium chloride, and sodium dihydrogen phosphate were purchased from VWR and were used for the preparation of artificial cerebrospinal fluid (a-CSF). Dopamine hydrochloride, serotonin hydrochloride, uric acid and ascorbic acid were purchased from Sigma Aldrich. Phosphate buffer Saline (PBS) was purchased from Corning. All water-based solutions were prepared using ultrapure water obtained from a water purification system with a resistance of 18 MΩ.cm-1.
4.2. Equipment
760E Electrochemical Analyzer (CH Instruments, Bee Cave, Texas).
4.3. Protocol
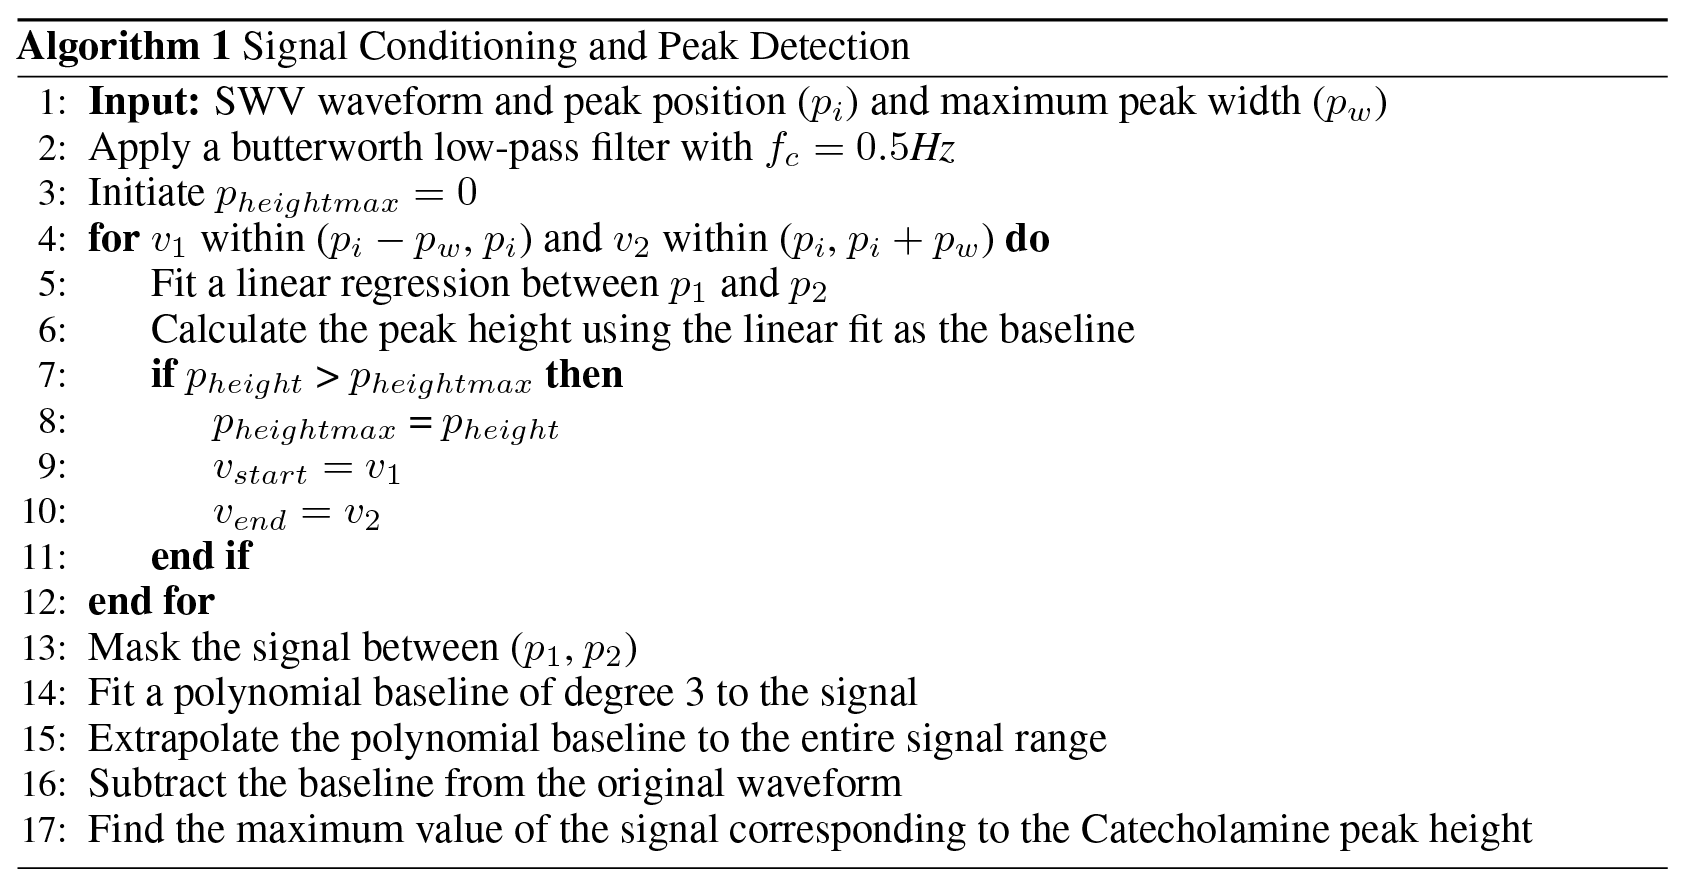
In order to measure dopamine concentrations we used square wave voltammetry (SWV) technique for the detection of dopamine. According to previous works in the field, after observing the dopamine peak at 0.183 V, a low-pass butterworth filter with a cutoff frequency of 0.5 Hz is applied to the SWV to eliminate high-frequency noise. To measure the peak starting and ending points, a linear regression is established between a point before to a point after the peak. Then this line is used as the baseline to measure the peak height at 0.183 V. This process is iteratively continued for all the points between (0.183 - pw) and (0.183 + pw). pw should be chosen to be larger than the peak area. We conservatively chose a value of 0.6 V. After this process, the linear line that results in the highest peak value is the line determining the peak range. We use the two points used in establishing this linear fit as the peak starting and ending points. After this step, the SWV is masked between the peak starting and ending points, and a polynomial baseline of third degree is fitted to the signal. After extrapolating this baseline to the entire range of SWV, the capacitive background current is estimated. After removing this baseline from the SWV, the value of the dopamine peak is used to establish the calibration curve.
4.3.1. Voltammetric Detection of Dopamine
- Connect the modified electrodes to the potentiostat.
- Put 500 µl of a-CSF on the electrode.
- Spike the solutions with dopamine to get the desired concentration.
- Perform SWV from 0 to 0.3 V with 0.001 V increment and 5Hz frequency.
- Repeat 3rd and 4th steps again for each desired concentration.
- Rinse the electrodes with DI water.
4.3.2. Voltammetry Detection of Serotonin
- Connect the modified electrodes to the potentiostat.
- Put 500 µl of a-CSF on the electrode.
- Spike the solutions with Serotonin to get the desired concentration.
- Perform SWV from 0 to 0.3 V with 0.001 V increment and 5Hz frequency.
- Repeat 3rd and 4th steps again for each desired concentration.
- Rinse the electrodes with DI water.
4.4. Results
After successful modification of the sensor, we performed a series of experiments to evaluate the sensitivity and selectivity of the sensors. Dopamine and serotonin are crucial neurotransmitters in the brain, each playing significant roles in regulating mood, emotion, and various physiological functions. As shown in Figure 4.1, both of these neurotransmitters are electroactive, meaning they can undergo redox reactions. We use the electroactivity of these neurotransmitters to detect them using SWV technique.
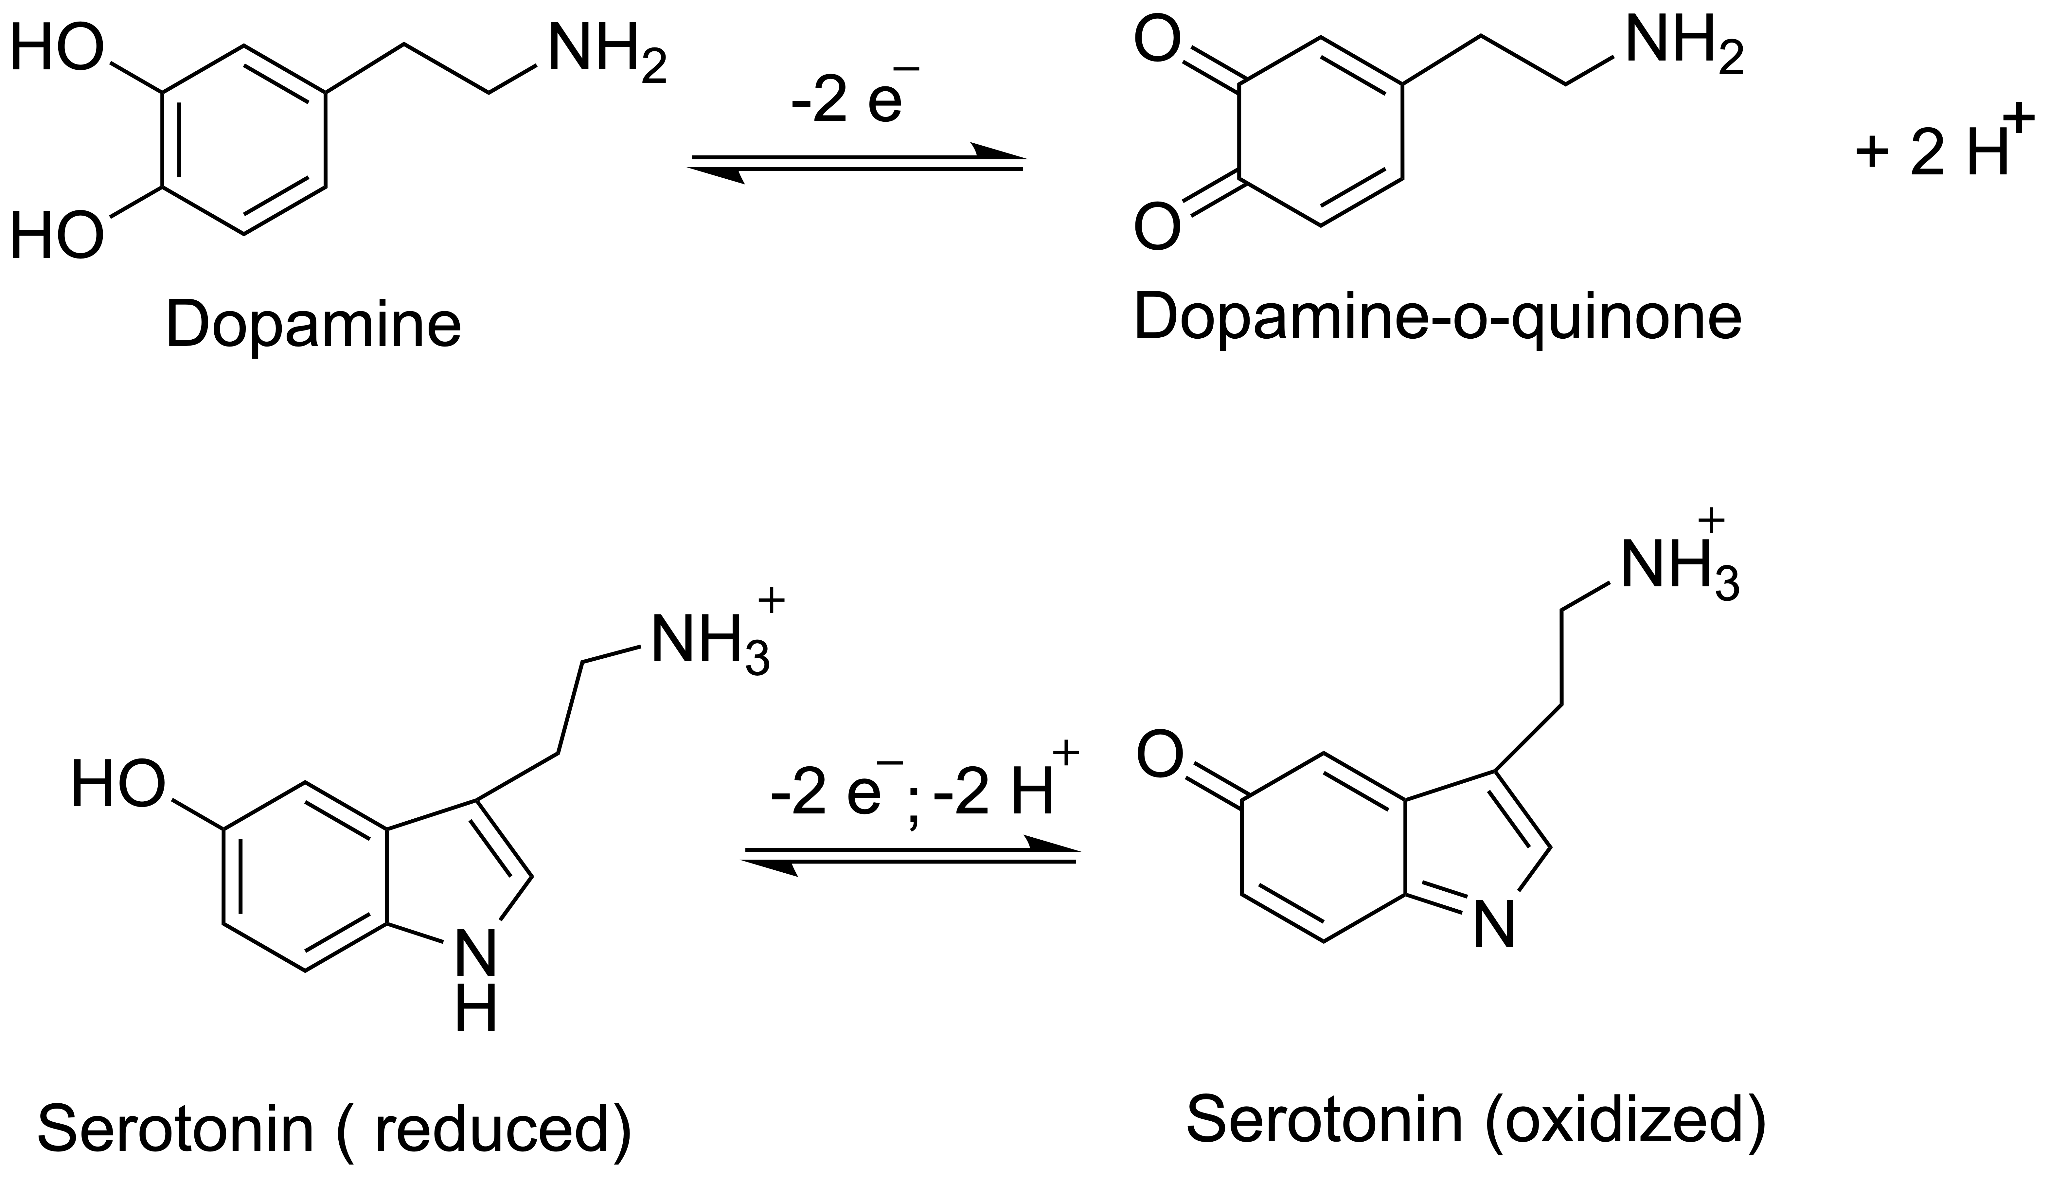
Figure 4.1. Redox reactions of dopamine and serotonin.
The SWV results (Figure 4.2A and 4.2C) indicated the feasibility of the fabricated electrode in response to various concentrations of dopamine and serotonin in a-CSF, respectively. Moreover, Figure 4.2B and 4.2D indicate the linear relationship between the peak current and concentration of the neurotransmitter, over a wide concentration range.
We conducted an in-depth evaluation of the selectivity of the electrodes. Our primary goal was to differentiate dopamine from other prevalent interfering species in the brain, specifically serotonin, ascorbic acid, and uric acid. To ensure the accuracy of our selectivity assessment, we extended the potential window of the SWV waveform from its initial range to -0.2 V to 0.6 V. This expansion was crucial for identifying the oxidation peaks of interfering species that were not observable within the original potential window. As shown in Figure 4.3A and 4.3B, in the presence of dopamine, we detected distinct oxidation peaks for ascorbic acid, uric acid, and serotonin at 0.042 V, 0.422 V, and 0.343 V, respectively. Notably, these peaks did not overlap with the dopamine signal, indicating that there was no potential interference from these species. The results highlight the high selectivity of the electrodes for dopamine detection.
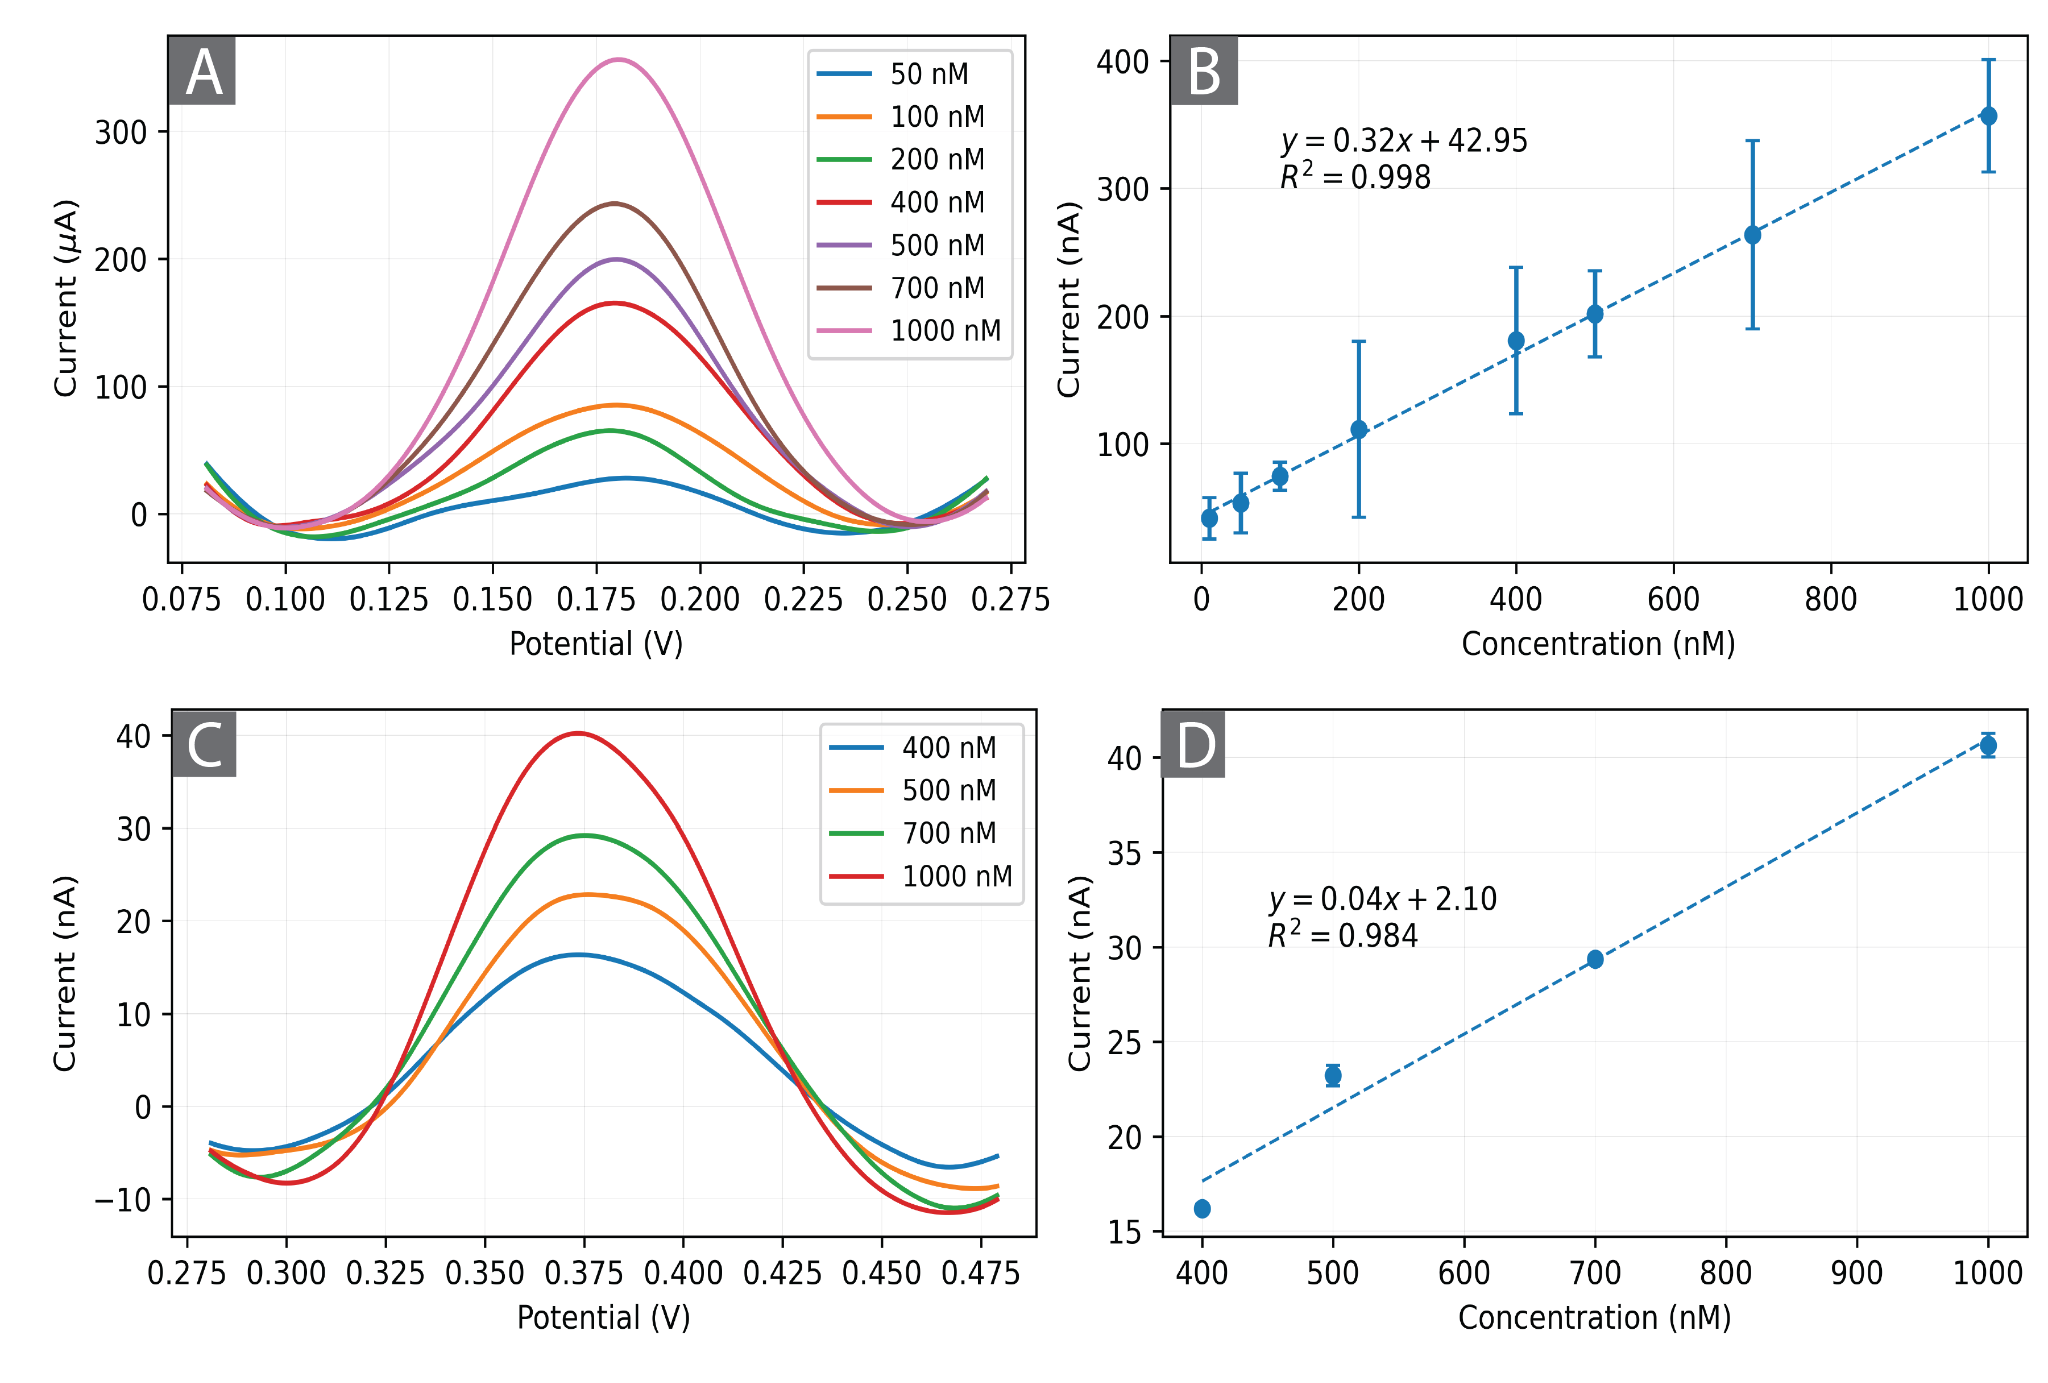
Figure 4.2. (A) The peak of dopamine oxidation in multiple SWV measurements with Au/Pd-PEDOT modified electrodes (B) The calibration curve of Au/Pd-PEDOT modified electrodes to Dopamine concentrations in a-CSF. (C) The peak of serotonin oxidation in multiple SWV measurements with Au/Pd-PEDOT modified electrodes. (D) The calibration curve of Au/Pd-PEDOT modified electrodes to Serotonin concentrations in a-CSF.
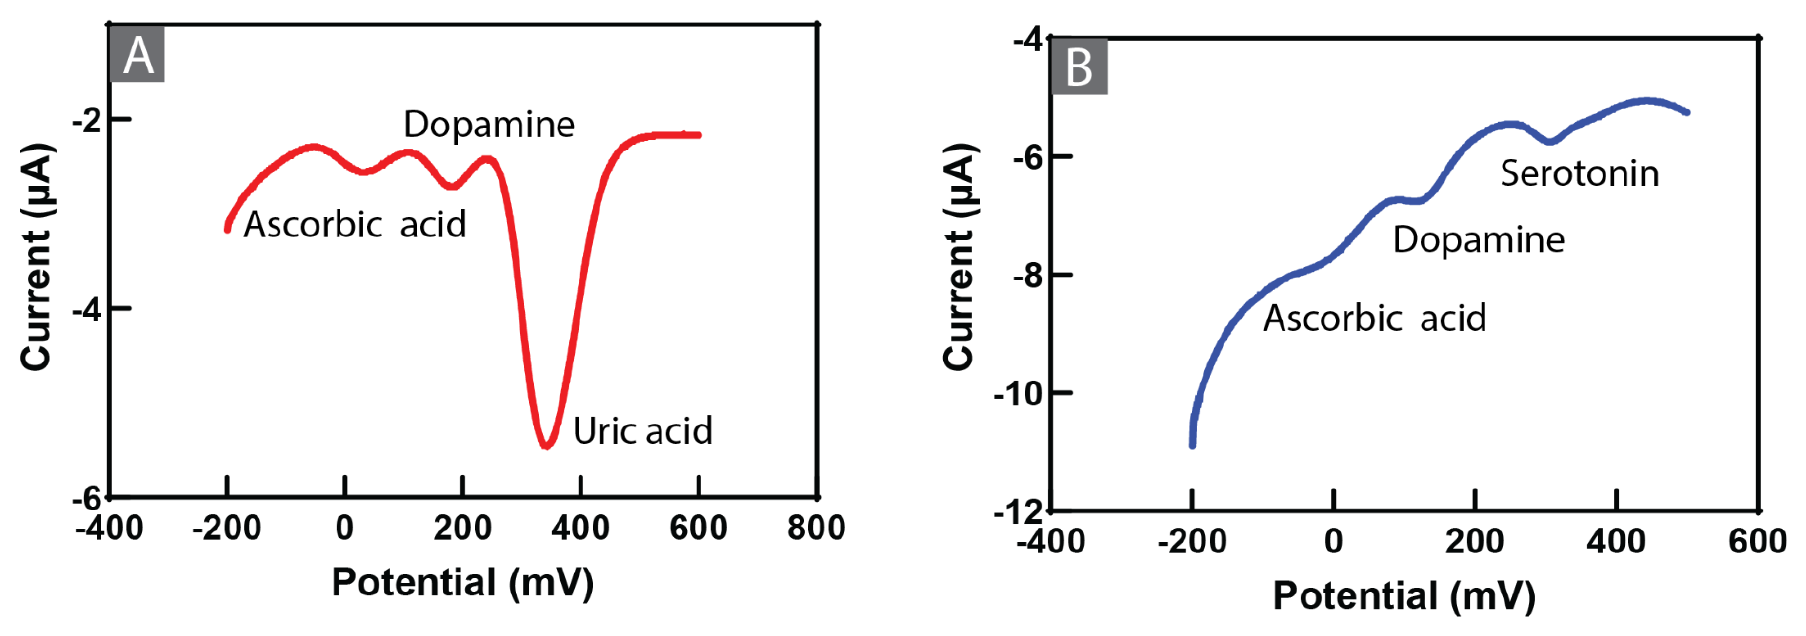
Figure 4.3. Selectivity of the sensors. (A) SWV of Ascorbic acid: 900 µM, Dopamine: 10 µM, Uric acid: 10 µM. (B) SWV of Ascorbic acid: 900 µM, Dopamine: 10 µM, Serotonin: 10 µM.
5. Laser-Engraving for Fabrication of Thin Film Parylene Electrodes
5.1. Materials
Parylene C dimer (980130-C-01LBE, Dimer, DPX-C from SCS)
5.3. Equipment
- SCS 2010/LABCOTER 3 Parylene Deposition System
- Ossila contact angle goniometer
- Ossila Four-Point Probe
5.4. Protocol
The parylene C-based electrodes are the gold standard that we are utilizing for this study. However, due to poor ion-to-electron transduction of the metals we are investigating carbonization of the parylene C and possible modification of the parylene C-based electrodes for potentiometric sensing. The parylene C layer is deposited on a 4" silicon wafer and carbonized via laser source 30 W maximum power. The resistivity and contact angles were measured after engraving.
5.5. Results
Lasing parameters were optimized to achieve a film with high conductivity, and outstanding mechanical properties (engraved leads stable after mechanical stress). Laser power and speed were altered and the carbonized films were evaluated. Sheet resistivity and contact angles were measured (Fig. 5.1 and 5.2) to identify the best lasing conditions. The optimized lasing conditions were utilized for fabrication of laser engraved electrodes (LIG) in Sections 6 and 7 for ACh and pH sensing.
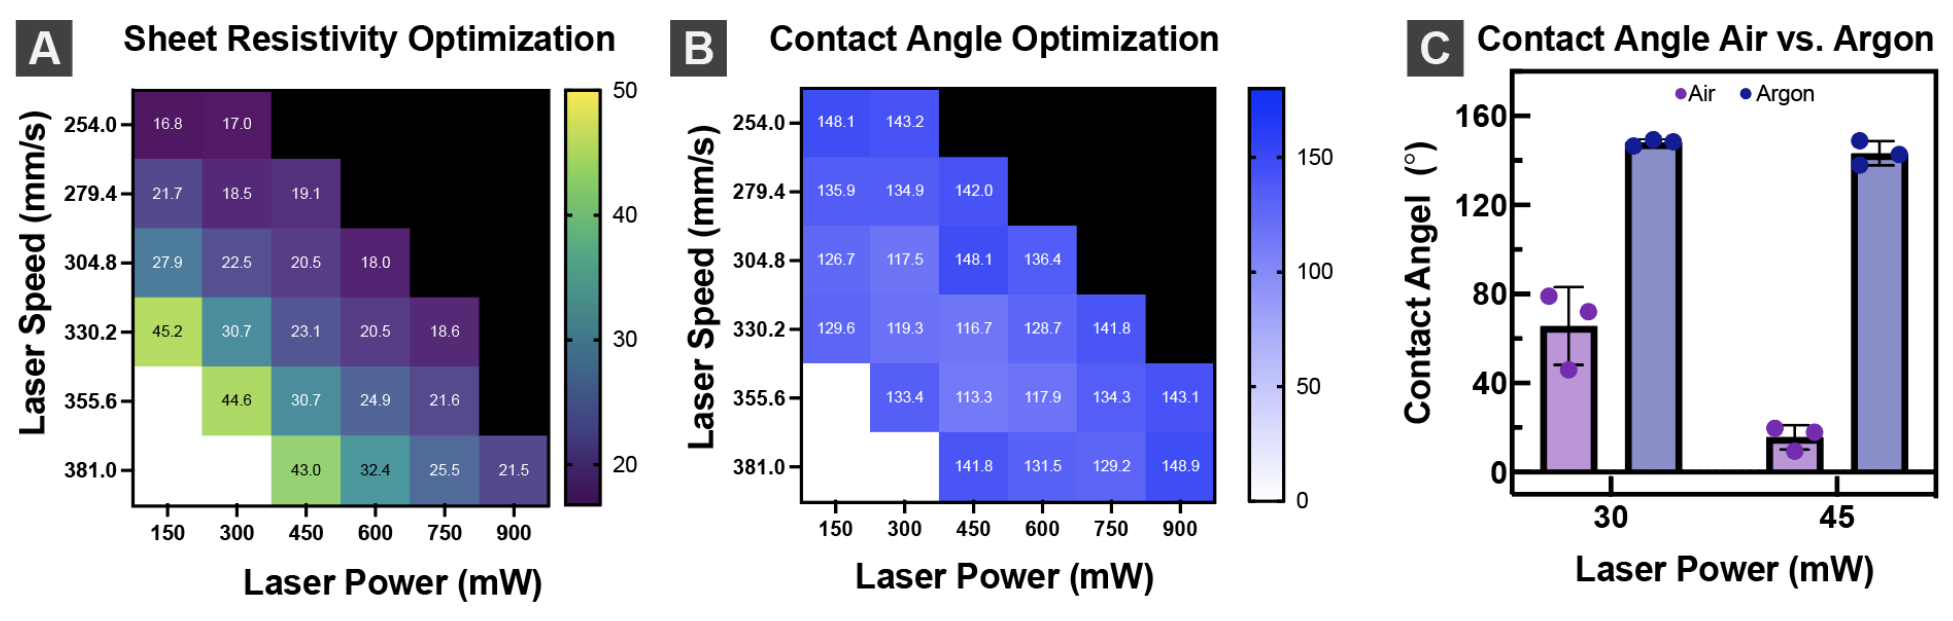
Figure 5.1. Laser engraving optimization (A) Sheet resistivity (Ohm/sqr) (B) Contact angle (C) Comparison of contact angle under different engraving environments.
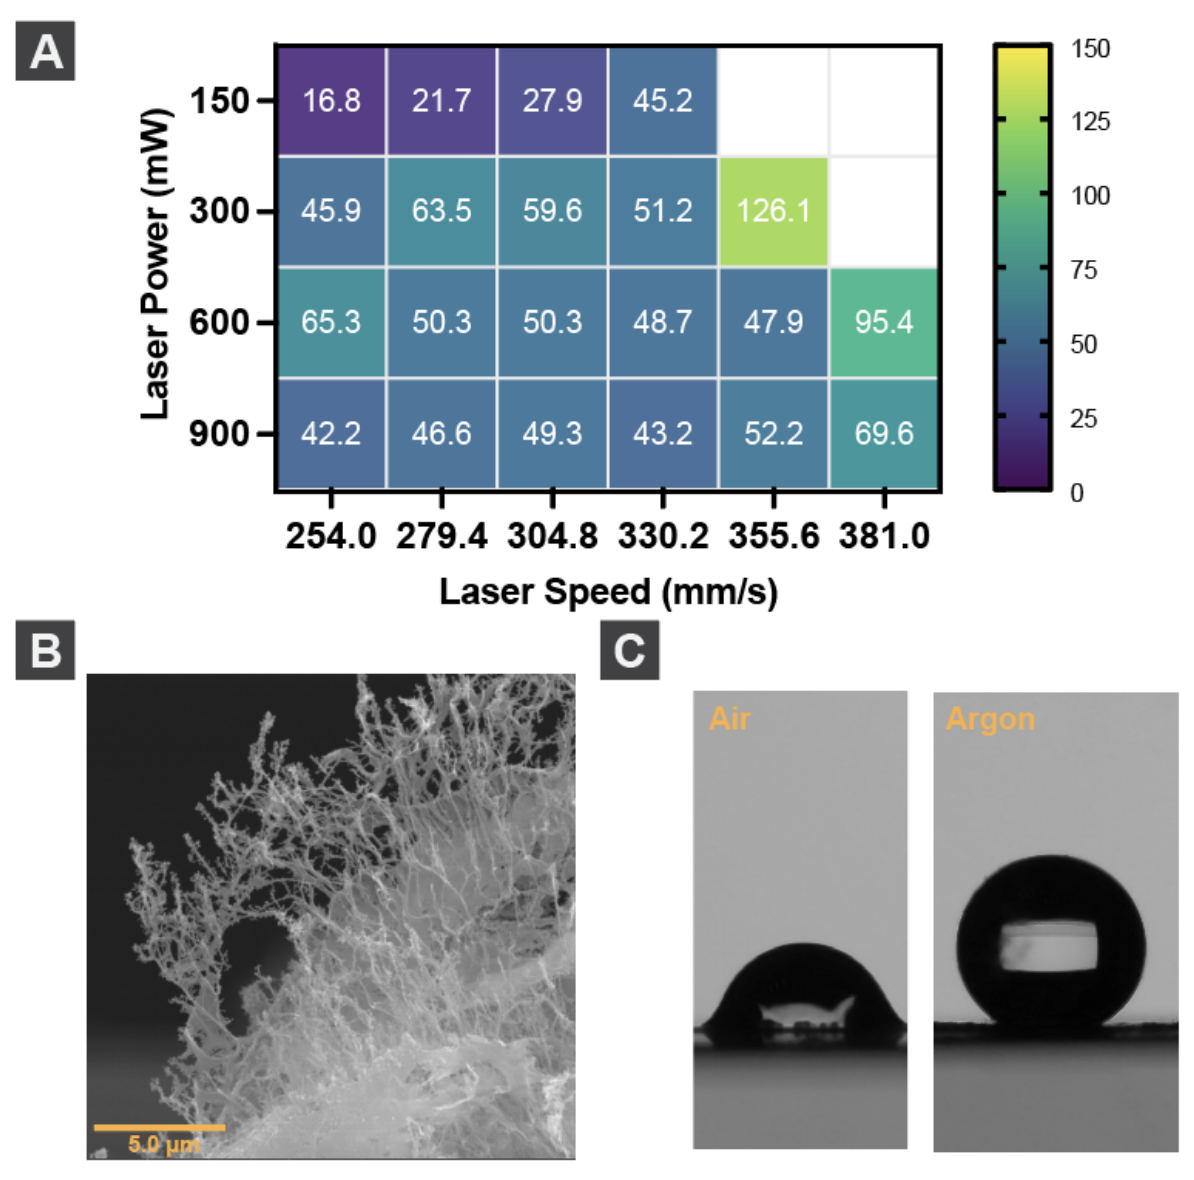
Figure 5.2. Optimization of lasing conditions for carbonization of parylene C. (A) Sheet resistivity (unit ohm/sqr) (B) SEM cross section of carbonized parylene C. (C) Contact angle comparison of carbonized parylene C fabricated under air and argon environment.
6. Fabrication Protocols for pH Sensors
6.1. Materials
Iridium (IV) chloride hydrate (IrCl₄ · xH₂O) was used as an iridium precursor in the preparation process of the iridium oxide electrodeposition solution. Nitric acid (HNO₃), 70.0%, and sodium hydroxide (NaOH) pellets were used to adjust the pH levels through the deposition solution preparation.
6.2. Equipment
CHI 760e Electrochemical Analyzer (CH Instruments). EMF 16 Precision Electrochemistry EMF Interface with EMF suite software version 2.0.
6.3. Protocol
IrOx nanoparticles were electrochemically deposited on LIG electrodes to develop the pH sensor. The solution preparation and electrodeposition protocols are as below.
6.3.1. Solution Preparation
We prepared 2.0 mM iridium (IV) chloride hydrate (IrCl₄ · xH₂O) solution in deionized water. Then, we adjusted the pH of the aqueous solution to 13 using 10% NaOH to hydrolyze the iridium (IV) salt and produce a yellowish-colored iridium hydroxide. After that, the solution was stirred at 90 °C for 30 minutes to accelerate the hydrolysis reaction and produce a light blue solution of IrOx-nH2O colloids. After that, we used a 3.0 M HNO3 solution to adjust the pH value to 1.5 to enhance iridium oxide's protonation and form Ir-O-Ir linkage indicated by the change of solution color into deep blue. We adjusted the pH again to 13 by using 10% NaOH solution.
6.3.2. IrOX Electrodeposition
We used the obtained solution to deposit IrOx on the LIG electrode surface using the electrochemical cyclic voltammetry technique. The deposition process was conducted at a potential window between -0.6 to 0.65 and a scan rate of 150 mV/s for 300 cycles. Ag/AgCl and platinum were used as reference and counter electrodes, respectively. Fig. 6.1A shows the cyclic voltammogram of the deposition process.
6.4. Results
The emf of three sensors was recorded in Britton–Robinson buffer solutions at pH values from around 4 to 9. Figure 6.1B, demonstrates the sensor sensitivity toward pH values, while changing pH values in the studied range. The sensors showed linear sensitivity to pH values as shown in Fig. 6.1C-D. Notably, the slope and intercept values of the linear regressions diverged when transitioning from basic to acidic solutions versus the reverse sequence. The recorded slope while increasing pH values was -69.01 mV/pH while it was -66.61 in the reverse direction. This mismatch suggests the presence of hysteretic behavior in the sensors. Hysteresis appears because the structural changes of IrOx may not revert immediately upon reversal of pH conditions. This behavior can be addressed by doing modification in the electrodeposition process (solution and/or electrochemical technique), introducing further processing and treatment for the obtained film before testing, and narrowing the studied pH range to physiologically-relevant values.
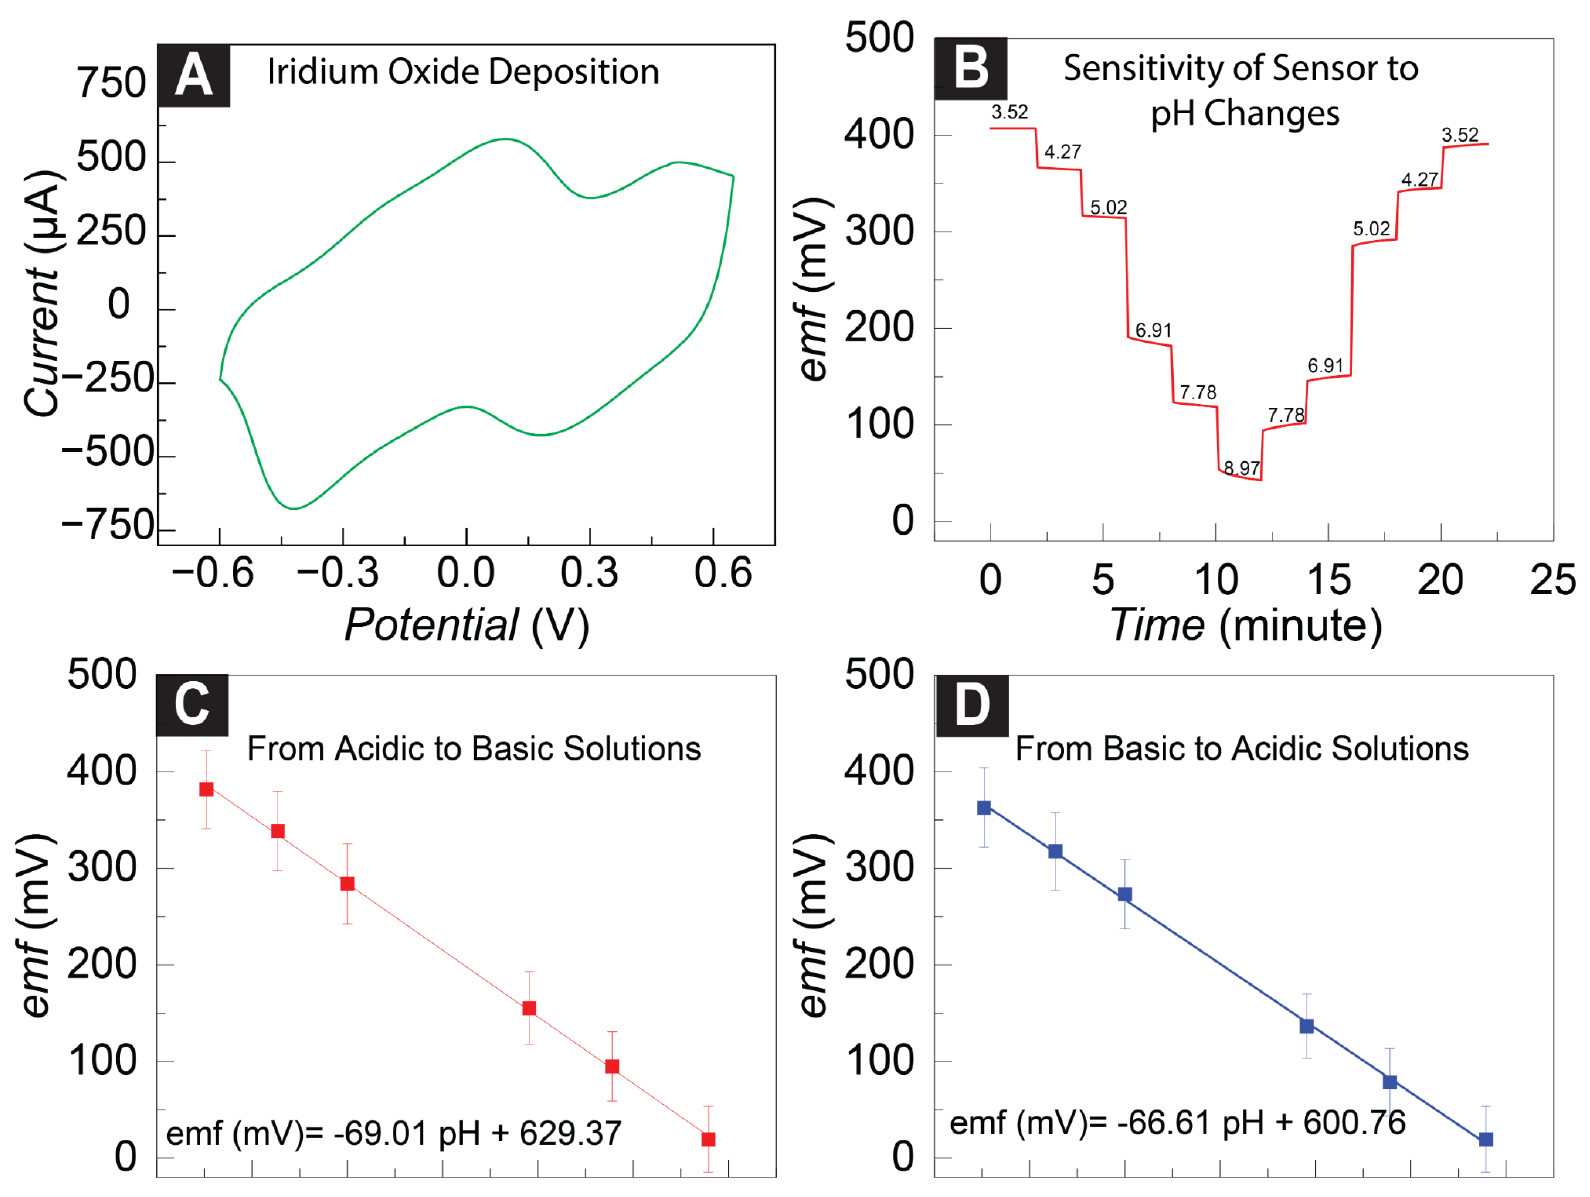
Figure 6.1. (A) Cyclic Voltammogram for IrOx deposition on LIG electrodes. (B) The response of LIG-IrOx in Britton–Robinson buffer solutions at pH values from around 4 to 9. (C) The obtained calibration curve of the developed pH sensor while changing from acidic to basic solutions. (D) The obtained calibration curve of the developed pH sensor while changing from basic to acid solutions. (Error bars are SD for three different sensors).
7. Fabrication Protocols for Acetylcholine Sensor
7.1. Materials
Sodium tetrakis [3,5-bis(trifluoromethyl)phenyl]borate (NaTFPB), calix[4]arene (CX4), 2-nitrophenyl octyl ether (o-NPOE), high molecular-weight poly(vinyl chloride) (PVC), tetrahydrofuran (THF, inhibitor-free, for HPLC), were purchased from Sigma Aldrich. Polyimide film with a thickness of 25 microns was purchased from McMaster-Carr.
7.2. Equipment
- EMF 16 Precision Electrochemistry EMF Interface with EMF suite software version 2.0
- VLS2.30, Universal Laser Systems Inc.
- Ossila contact angle goniometer
- Ossila Four-Point Probe
7.3. Protocol
7.3.1. Electrode Fabrication
- The laser-induced graphene electrode was fabricated by ablating the laser power, laser speed, and image density on the polyimide-based substrate. Here, we also studied the influence engraving environment by engraving under two different conditions: (i) Air (ii) Argon environment.
- The acetylcholine-selective membrane was prepared by mixing 1.0 mg NaTFPB (ionic site) and 11.0 mg of CX4 (ionophore) in a polymeric backbone consisting of 330.0 mg of polyvinyl chloride (PVC) and 660.0 mg of nitrophenyl octyl ether (o-NPOE). The resultant acetylcholine-selective membrane (1.0 g) was dissolved in 3.0 mL of tetrahydrofuran (THF) and kept under contentious stirring overnight at room temperature. After reaching a homogeneous acetylcholine-selective precursor, we spiked the polymeric solution with 5.0 µL of 10.0 mM acetylcholine chloride to facilitate electrode conditioning and exchange of the ionic salt with acetylcholine ion, where an opaque precursor formed after being stirred for 24 hours.
- The acetylcholine-selective precursor drop-cast on the exposed electrode area, allowing the organic solvent (THF) to evaporate. After 12 hours the electrodes were ready to be tested.
7.3.2. Accelerated Aging Test
Accelerated Aging is a process of securing electrodes in a chamber with elevated temperature to assess the performance of the fabricated electrodes for prolonged studies. Here, we follow guidelines based on the ASTM-F1980 protocol which is based on the Q10 paradigm, which stipulates that for every 10-degree increase, it doubles the reaction rate of the materials. The accelerated aging time is calculated based on the:
$$Accelerated\ Aging\ time = Desired\ real\ time \mathbin{/} Q10^{(T_{AA} - T_{RT})/10}$$
Where Q10 is the conservative aging factor (normally is 2.0), TAA is the accelerated aging temperature in °C (temperature aging study is conducted, 60°C). The TRT is the ambient temperature in (storage temperature for real-time aging, normally 25°C).
7.4. Results
We optimized the carbonization of the polyimide substrate by altering the laser power laser, and speed to achieve stable yet low resistive graphene patterns. The power was changed from 150 mW to 900 mW, and the laser speed was increased from 254 mm/s to 381 mm/s. We investigated the hydrophilicity and hydrophobicity of the engraved graphene patterns by altering the engraving environment. We introduced 20 psi of air or argon gas to the engraving chamber. Argon was selected due to its inert nature and being more dense than oxygen to facilitate reducing the oxygen content of the fabricated graphene electrodes to achieve more hydrophobic electrodes. The emf of the electrode was monitored over one hour to quantify the drift values. The hypothesis to create hydrophobic LIG-based electrodes was to minimize the water layer formation for the in vivo studies. Therefore, we compared the water-layer formation in both air and argon-based LIG electrodes, where the argon-based LIGs illustrated an improved response.
We assessed the feasibility of the fabricated electrode in response to various concentrations of acetylcholine in artificial cerebrospinal fluid (a-CSF), which recapitulates biologically relevant conditions (Figure 7.1).
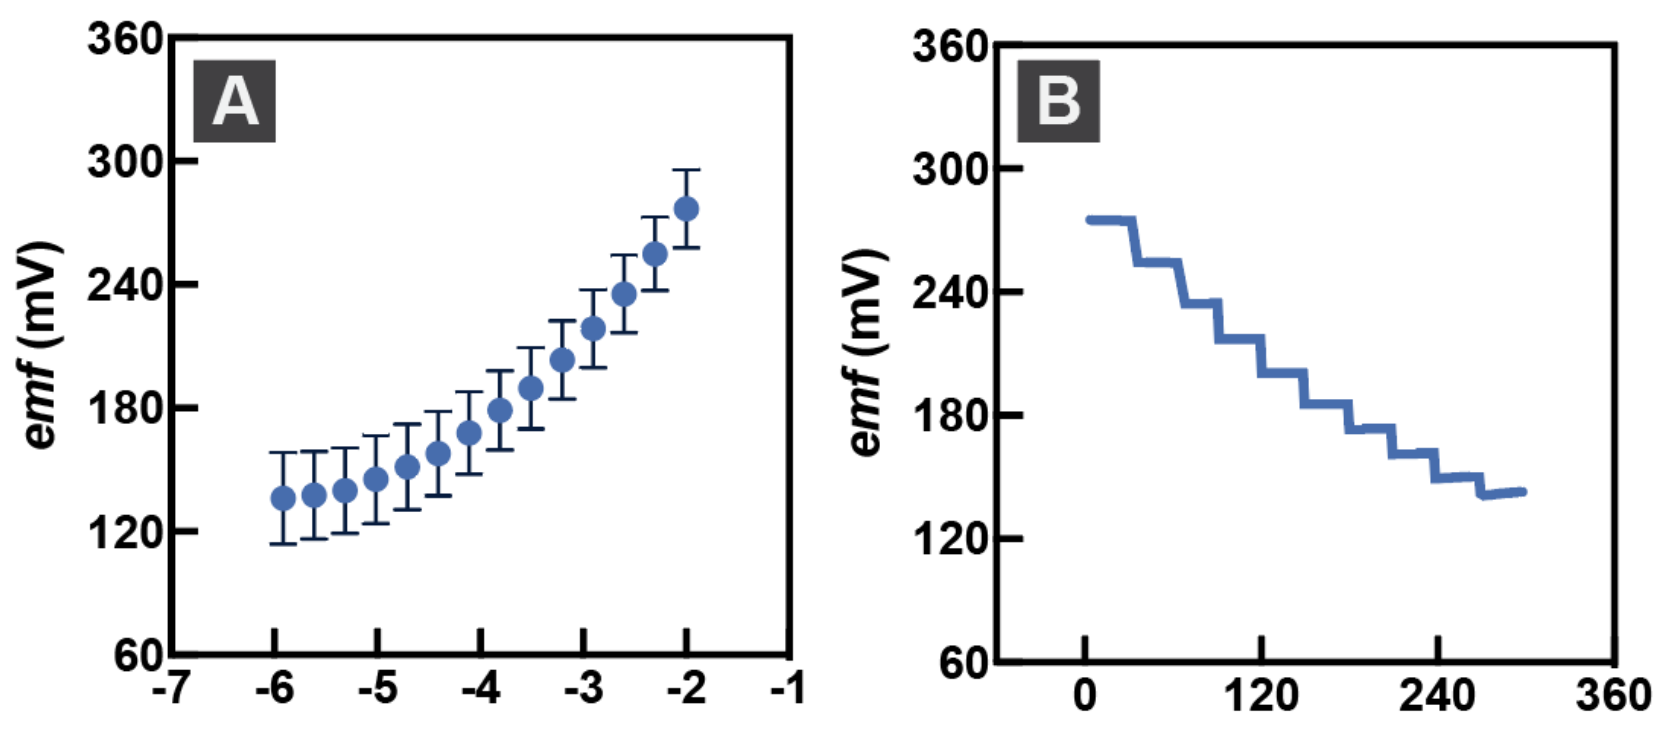
Figure 7.1. (A) Calibration curve of the developed acetylcholine sensor in acetylcholine chloride standards. (B) The emf of the developed acetylcholine sensor in acetylcholine chloride standards (concentrations were changed by successive dilutions).
Figure 7.2 is not referenced anywhere in the source document — the text and figures jump directly from Figure 7.1 to Figure 7.3. That gap is preserved here rather than renumbered.
We assessed the sheet resistivity and contact angle of the carbonized parylene. Moreover, we assessed the emf of the carbonized parylene C electrodes to the ACh where we observed a Nernstian behavior as expected. Further, we studied the change of capacitance in different electrode materials since it directly correlated with the stability of the electrodes, the carbonized parylene C illustrated the highest capacitance followed by LIG and the lowest capacitance seen in platinum-based electrodes. Moreover, we investigated the water layer formation in carbonized parylene C electrodes, the optimized parameters which resulted in maximum capacitance resulted in an improved emf response recovery (Fig. 7.3).
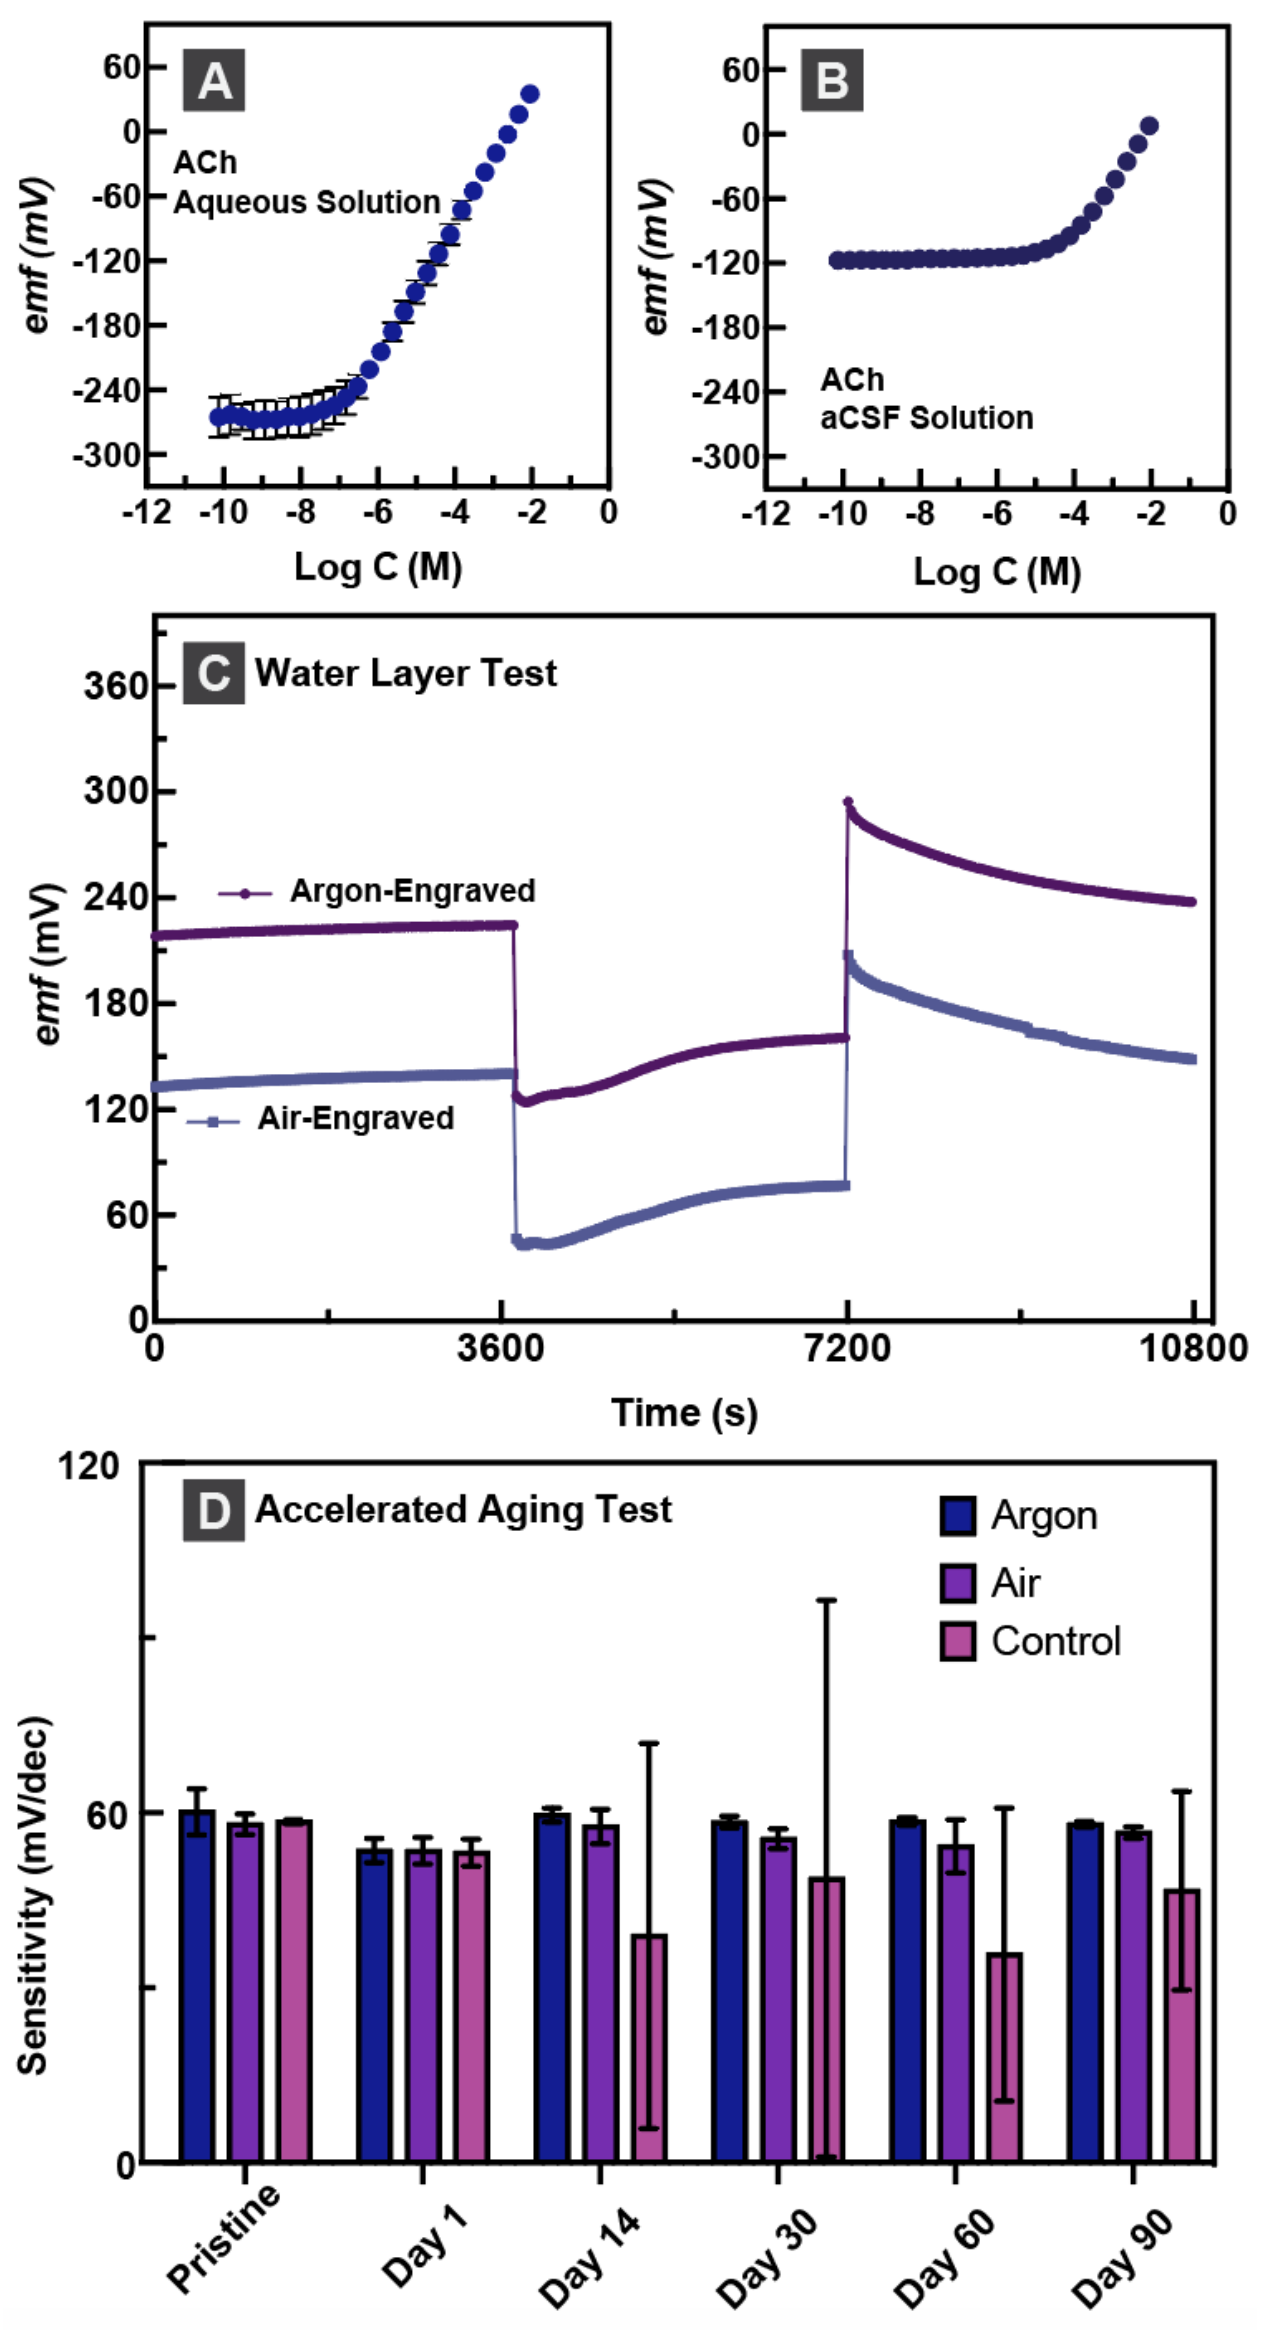
Figure 7.3. ACh feasibility on LIG-based electrodes (A) Calibration in aqueous solution (B) Calibration in a-CSF (C) Water layer test (D) Accelerated Aging Test.
8. Acute Animal Testing
8.1. Materials
Sodium chloride, calcium chloride, potassium chloride, magnesium chloride, and sodium dihydrogen phosphate were purchased from VWR and were used for the preparation of artificial cerebrospinal fluid (a-CSF). Dopamine hydrochloride and serotonin hydrochloride were purchased from Sigma Aldrich. Phosphate buffer Saline (PBS) was purchased from Corning. All water-based solutions were prepared using ultrapure water obtained from a water purification system with a resistance of 18 MΩ.cm-1.
8.2. Equipment
- 760E Electrochemical Analyzer (CH Instruments, Bee Cave, Texas).
- EMF 16 Precision Electrochemistry EMF Interface with EMF suite software version 2.0
8.3. Protocol
Standard craniotomy procedures was performed on the rat.
Square wave voltammetry protocols were similar to those explained in sections 4.3.1 and 4.3.2.
8.4. Results
We evaluated the feasibility of our sensor by conducting in vivo experiments on a rat model. Initially, we positioned the sensor on the dorsal brain region of the rat and recorded a baseline using SWV. Subsequently, we injected dopamine directly into the brain tissue and performed SWV measurements. The results, shown in Figure 8.1A, indicated an increase in the peak current at the potential characteristic of dopamine oxidation, confirming the sensor's responsiveness to dopamine. Additionally, a second sensor was implanted in the left limb of the rat, where we administered dopamine injections into the limb tissue. The results demonstrated an increase in the peak current following repeated dopamine injections, further validating the sensor's ability to detect dopamine in different tissues (Figure 8.1B). Similar measurements were performed on ACh sensors, where the sensor was placed on the brain tissue, and acetylcholine chloride solution was injected into the brain tissue. The electrodes showed a stable baseline read before injection of AChCl. Immediately after injection of AChCl, an increase in the emf was observed, indicating that sensors are responding to ACh. The emf decreases rapidly post injection, due to degradation of ACh by acetylcholinesterase (Fig. 8.2).
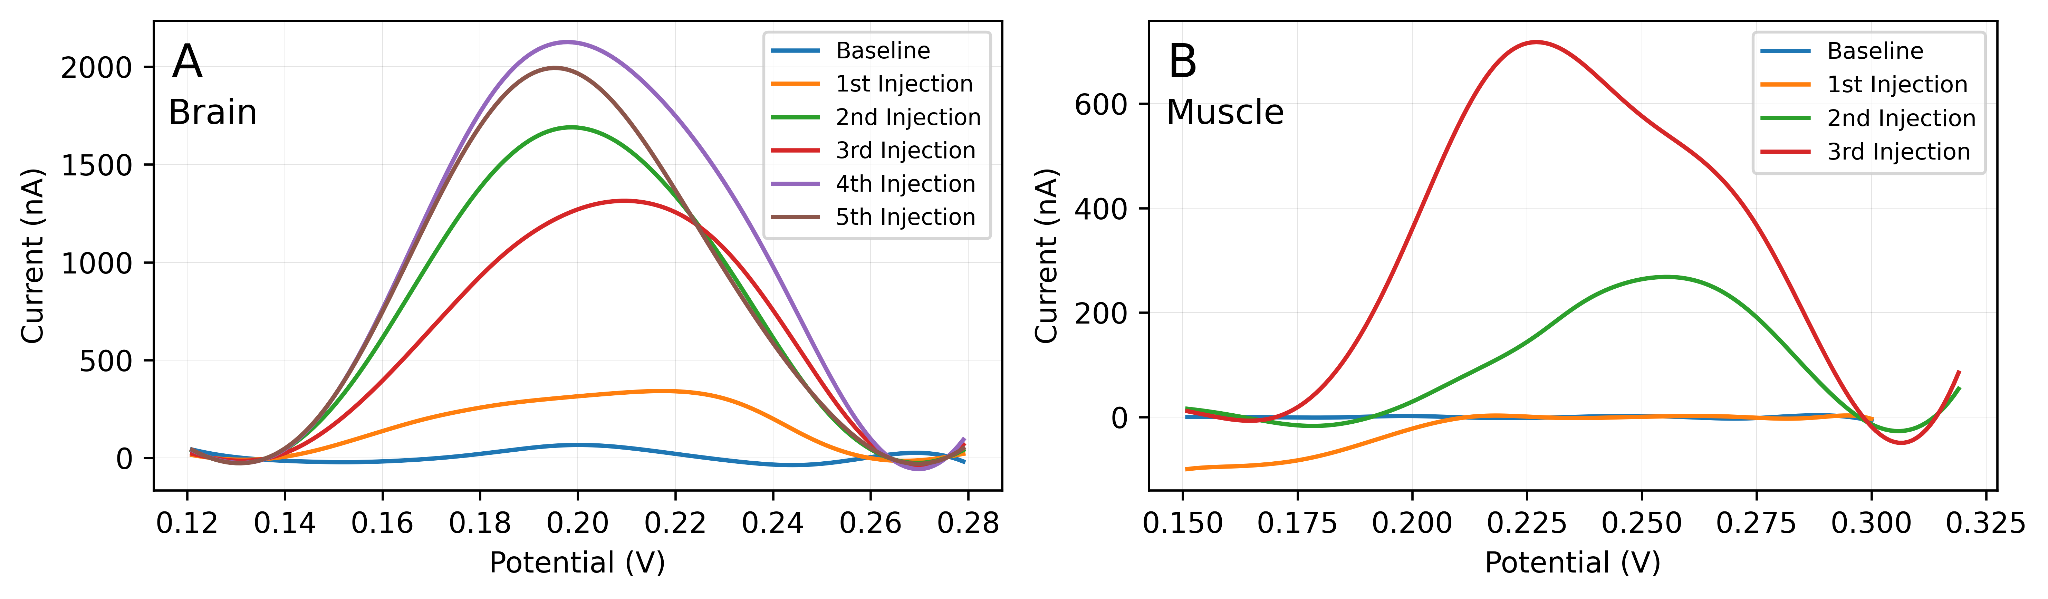
Figure 8.1. In-vivo detection of dopamine. (A) dopamine detection in rat brain. (B) Dopamine detection in the rat limb.
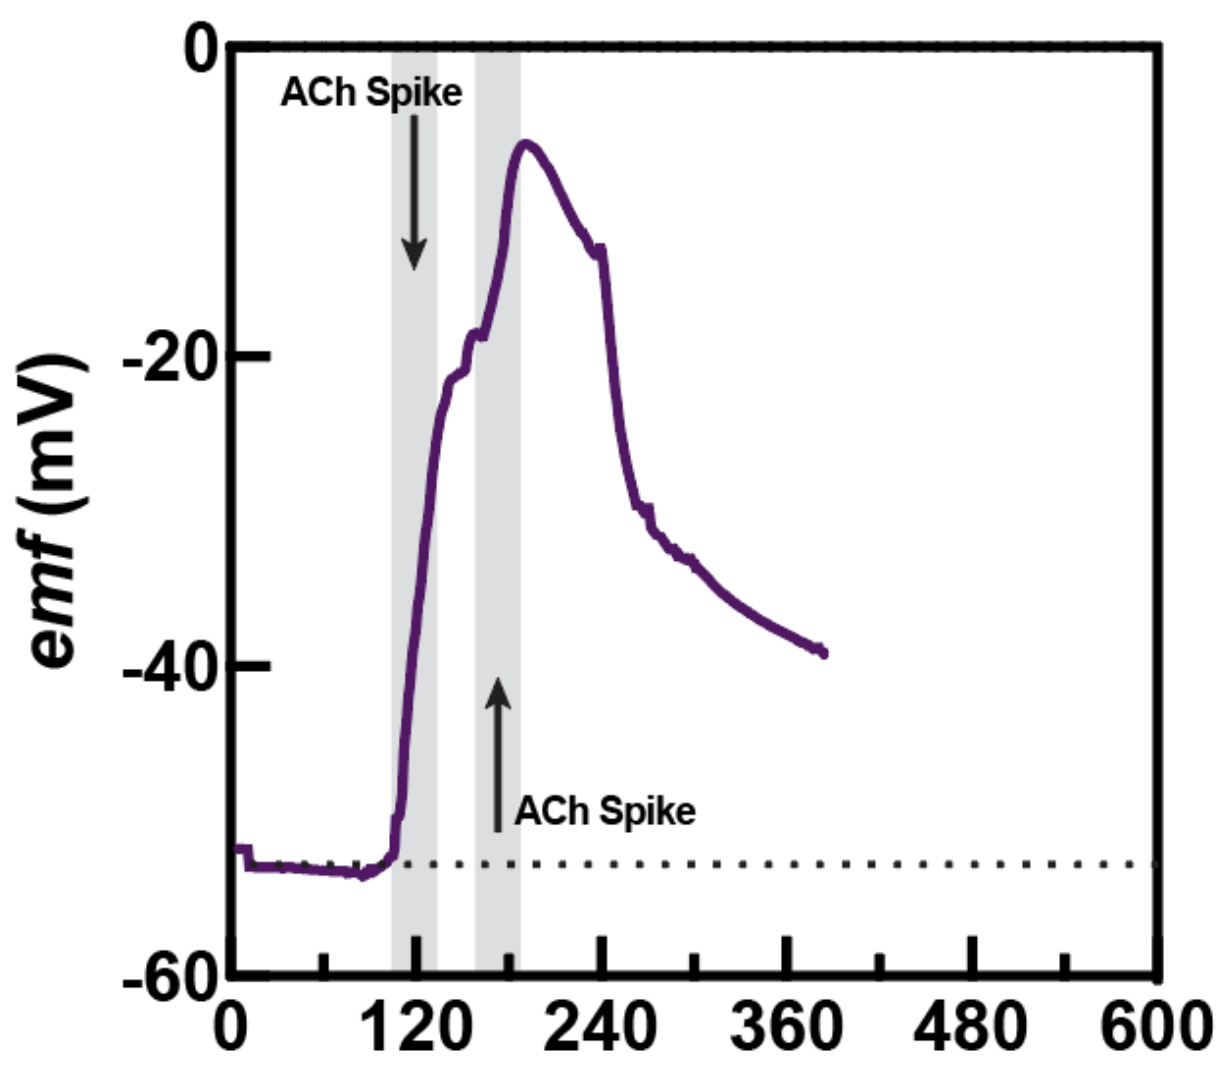
Figure 8.2. In-vivo detection of acetylcholine via carbonized parylene C electrodes.